Preliminary experiments:
We are trying to find out how temperature affects the resistance of the wire.
Apparatus
Results
Thermistor
Coil
From these experiments it can be seen that as you increase the temperature, the resistance decrease and as you increase the length of wire the resistance also increases.
Apparatus for the main experiment:
In this experiment the only main risk is that the wire could get hot and you could burn yourself, so you should take care and do the experiment as quickly as possible.
Here is my method for the main experiment:
∙Collect the apparatus shown in the diagram.
∙Place the wires 10cm apart and take a reading and record your results in a table.
∙Repeat this at: 10cm, 20cm, 30cm, 40cm, 50cm, 60cm, 70cm, 80cm and 90cm and record your results.
∙Once you have all the results, go back down from 90cm to 10cm and record the results.
∙Then calculate the average and plot a graph using your averages.
∙Draw a line of best fit on your graph.
∙Clear away all apparatus.
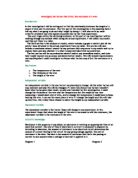
Obtained information
Analysis
As I predicted, from looking at my graph and results, it can be seen that as I increased the length of wire, the resistance also increased. The length is directly proportional to the resistance, because a straight line goes through the origin.
When you increase the length of wire, it is like adding resistance in series. If you add resistance in series, the total resistance is found by adding them all up.
I predicted that as I increase the length of wire, the resistance would also increase. When the length of wire is 10cm, the resistance is 1.6ohms and at 90cm, the resistance is 11.4ohms. This proves that my prediction was correct and can be seen from looking at my results table and graph.
Evaluation section
Evaluating the results
I think that most of my results are reliable and the repeats had close results. At 60cm the two results were 7.7ohms and 8.6ohms, this was my most varied result, with a difference of 0.9ohms. There were no overlaps between my results, which shows that they were quite reliable. At 70cm the results are no longer on the line of best fit on my graph, but are still very close. The length is directly proportional to the resistance and it’s a straight-line graph through the origin. Some of my results were anomalous; to improve this I could have used a razor blade to get more accurate results. I could have repeated the experiment using a different thickness of wire or repeated the experiment more times to have more reliable results.
Evaluating the procedure
My independent variable varied fro, 10cm to 90cm going up steadily at 10cm a time. I collected reasonably reliable results, but to be more accurate I could have measured 15cm, 20cm, 25cm etc and gone up 5cm a time. The accuracy of the length of wire was difficult to control, it could have been a few millimetres out which could have affected the resistance of the wire. I was only using crocodile clips and a ruler to measure the length of wire. This made the results not as reliable as they could have been. To improve my procedure I could have used a razor blade on the end of the crocodile clip and put the blade on the ruler, this would have ensured more accurate results, therefore on my graph, and there would be a straight line.
Evaluating the conclusion
My conclusion stated that ‘from looking at my graph and results, it can be seen that as I increased the length of wire, the resistance also increased. The length is directly proportional to the resistance, because a straight line goes through the origin.’ I think that my conclusion is valid because my results are reliable. My graph I have drawn has a line of best fit and all of the points are very close to it.
The aim of my investigation was to identify the factors that affect the resistance of a wire in detail to find a more definite link. Here is a plan that could improve the accuracy and reliability of my results:
∙Collect the apparatus shown in the diagram.
∙Also collect a razor blade.
∙Place the wires 10cm apart using the blade and take a reading and record your results in a table.
∙Repeat this at: 10cm, 15cm, 20cm, 25cm, 30cm, 35cm, 40cm, 45cm, 50cm, 55cm, 60cm, 65cm, 70cm, 75cm, 80cm, 85cm and 90cm and record your results.
∙Once you have all the results, go back down from 90cm to 10cm and record the results.
∙Then calculate the average and plot a graph using your averages.
∙Draw a line of best fit on your graph.
∙Clear away all apparatus.