My catalyst is potatoe, which will be in strips. The potatoe will then be bored with a size 3 borer, and then the potatoe will be cut into 1.5cm long pieces, this is necessary to keep more active sights available to the peroxide as the cells in the middle of the strips will be hidden from the peroxide. I am going to use the same sample of potatoe all the time; this is to ensure that all samples are as pure as possible. Safety is always important, and so is fairness. Throughout the whole experiment safety glasses must be worn, as Hydrogen Peroxide can be dangerous if it gets into your eyes. Care was also taken whilst handling the chemicals as hydrogen peroxide is corrosive. To make sure the experiment is fair I must make sure nothing is changed for different experiments. I will use the same apparatus for each different experiment and I will make sure the same types of potatoe and Hydrogen Peroxide are used. The amount of enzyme must kept the same, and so should the size of the pieces, this is to keep the number of active sights the same in every reaction. Everything in the experiment should be kept the same apart from the concentration of the Hydrogen Peroxide. The temperature must also be kept the same. This is to keep the rate of reaction the same in all reactions, and so gain accurate results. This will be achieved by placing the experiment in a water bath at 30 . Each concentration will be repeated twice.
I am going to use seven different concentrations of peroxide, starting from 20vol, and going down to 8vol. The table below shows this:
Apparatus:
- Gas Biruette.
- Boiling Tubes.
- Water Bath.
- Plastic Containers.
- Delivery Tube.
- Bung.
- Stopwatch.
- Beehive Shell.
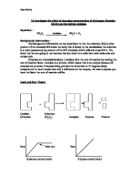
Diagram:
Prediction:
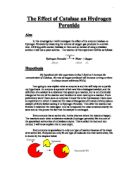
I would expect from this reaction that the quickest and most reacted concentration would be the 100%. I would expect 100% to react quickest because it has the most Hydrogen Peroxide molecules in it. With more of these molecules inside the solution, it is more likely that a collision will take place, molecules must collide in order to react. This means that a reaction is more likely to take place, in a shorter time, making the rate of reaction quicker. More collisions are needed because only one in every 10 to the 14 collisions lead to a successful reaction taking place. The more reactions that take place increases the amount of oxygen produced in the shortest time.
Method:
To find out how the concentration affects the rate of reaction, I shall measure how long it takes to collect 10cm of oxygen. The reaction I am investigating is:
2H O + catalase → 2H O + O
This reaction shows that oxygen is being produced.
Once all the samples have been prepared and the equipment I will be using is set up (water basin, a bung, a delivery tube, a measuring cylinder, a syringe, and a stopwatch), I will then collect the concentration of Hydrogen Peroxide I will need for the experiment I will be doing. I will fill the basin with water next and then fill the measuring cylinder as well. The measuring cylinder will be placed upside down in the basin still full of water. I will then stick the potatoe into the test tube. The next thing that must be done is to put the delivery tube and bung together and place the delivery tube under the measuring cylinder so that any gas pushed through will go into the measuring tube. I will then measure out my different concentrations of Hydrogen Peroxide. I will then place my potatoe in the concentration of hydrogen peroxide, then then the stopwatch will be started.
To collect our data we will be measuring the amount of oxygen produced from the reaction, by letting it pass through a tube and let it displace the water in the measuring cylinder, which starts out at 10ml3. All measurements will be made as precise as possible to keep the experiment accurate and fair.
Results:
The data obtained from this investigation has been recorded in a table showing the time, enzyme concentration and rate of reaction. This means that the results of the experiment are presented in a clear and orderly fashion that allows patterns in the results to become more obvious. All measurements were taken so that the stopwatch was started once the rubber tubing was sealed and the stopwatch stopped once the water inside the test tube had reached the base of the highest marked point.
Results Table:
The results I gained from the experiment are shown in the table above.
My results show me that the higher the concentration of a substrate, the quicker the reaction rate. The 100% concentration produced the most 02 in the shortest time, which gives it a higher reaction rate than the others. This shows that my prediction was correct, the highest concentration would produce the most 02 in the shortest time. As my prediction shows, more collisions produces more reactions.
The results then show that in order the reaction rate gets lower as each concentration gets lower. My results support my prediction, because as I said, the higher concentration the quicker more of the O2 is produced. Therefore my prediction was correct, from what my results show.
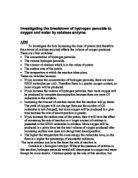
Analysing:
From the results I had collected I have now plotted a graph, showing the decomposition of the H O . Starting to look at this graph we can clearly see that with the line of best fit drawn the points are not that far away from this line. My graph still looks a bit odd, and some of the results could be wrong, however I can still pull some conclusions from this and one is that we can definitely see that with the stronger concentration the more oxygen we are producing. As you can see from the graph, at low substrate concentrations the rate of reaction is directly proportional to the substrate concentration due to the fact that when the substrate concentration is increased the rate of enzyme-substrate collisions (reaction) is equally increased. However, as the substrate concentration rises the rate of reaction will finally reach a maximum level. This is because all the active sites are saturated with substrate.
From my results I have found that the higher the concentration of Hydrogen Peroxide, the quicker the reaction rates, producing oxygen. The results I got were what I had expected and predicted, but I got a few
anomalous results. The data that I collected was reasonable for the accuracy of my experiment, it was fairly reliable meaning that the results we collected were mostly expected. A major cause for concern on accuracy was the reading of the overall measurement of the oxygen produced. So if these miss-readings were carried out through the whole investigation and so this may be why I have some anomalous results.