In order to obtain suitably accurate results, the potato must be tested in a variety of concentrations of water. I will place the samples of potato into solutions of varying concentration. I will use 5 different concentrations of water; a solution of pure water, a solution of 10% sugar, a solution of 20% sugar, a solution of 30% sugar, and a solution of 40% sugar. Obviously, I may not find the exact concentration of cell sap in one of these readings, but by comparing the results of each I can produce an estimate.
I will first place 4 uniform samples of potato into separate beakers, each with the same amount of different solutions in them. I will then leave them in a cupboard over the same period of time to conduct any osmosis that will occur. Having done that I will remove each potato sample, weigh it in turn, and then compare my results to discover which of the solutions is closest to the concentration of cell sap. This will be the solution whose potato incurred least weight change.
In order to conduct this experiment I will need the following apparatus:
5 100ml beakers,
1 potato,
1 potato corer,
1 measuring cylinder,
Weighing scales accurate to 2dp,
Samples of sugar solution with 0%, 10%, 20%, 30% and 40% sugar concentration,
Tweezers,
A ruler,
A scalpel.
To ensure that this experiment is accurate, it must be a fair test. In order to do this, I will need to keep certain variables within the experiment the same. These include maintaining the volume of solution I use each time and keeping the volume and surface area of the potato samples roughly the same (I intend to cut each potato sample to about 4cm). Both of these will mean that one potato sample will not have the opportunity to conduct any more osmosis than the others will, in relation to their concentrations. I must also give each sample an equal time to conduct any osmosis that will occur for the same reason. In order that my results are accurate, I must keep the degree of accuracy to which I take readings both appropriate and the same throughout. For example, I will measure the potato samples to the nearest mm, the volume of solution to the nearest ml, and the weight of potato samples to the nearest 2dp. This is necessary because I do not know how large any changes will be. Finally, as conditions around the beaker can affect the variables in the experiment, all beakers must be placed in the same conditions. I plan to place them in a cupboard so that their surroundings can have as little effect on them as possible.
Some variables however, do need to be changed for an experiment to be of any use. In this experiment I will change only one variable. This will be the sugar concentration of the 5 solutions I use. Each concentration will need to be measured accurately, in order that my results and conclusion will be as close as possible to the truth. The volume of solution I put in the beakers though, must remain the same.
I can increase still further the accuracy of my experiment by repeating the process a few times. Certain variables in the experiment are beyond my control, and for some reason a set of results may be inaccurate. The only way to discover if this is true is to compare a few sets of results. It cannot only be 2 however, as I need to know just how far out a set of results are. It is by comparing them to a third set of results that this may be judged. I will therefore repeat the experiment three times, and take the averages of the results a get, for increased accuracy.
Predictions
Beaker 1:
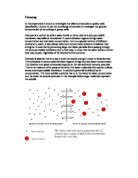
The results from the first beaker are easy to predict. I know that cell sap contains at least some sugar, but the solution this potato sample is placed in is pure water and so has none. The solution in beaker 1 has a far higher water concentration than the cell sap. I can therefore say that osmosis will definitely occur into the potato cell, and as a result it will gain weight.
Beaker 2:
In beaker 2 predictions are a little harder to make. This time the solution has a 10% sugar content. This could now meant that osmosis could occur into the potato cell. However, I do not predict that it will. Glucose is vitally important to a plant as it is converted into protein for growth, cellulose for cell walls to allow osmosis and is used as basic energy among other things. Consequently I expect that the cell sap has a glucose content of more than just 10%. Therefore, I predict that in beaker 2 some weight gain will occur, though less this time than in beaker 1.
Beaker 3:
My predictions for beaker three differ very little from those for beaker 2. Once again, I predict that cell sap contains more than 20% glucose. This time however, the wight gain incurred by the potato sample will be less than that in beaker 2, as the sugar content of the solution has increased, reducing its osmotic potential. Osmosis will also occur more slowly than in beaker 2.
Beaker 4:
In beaker 4 I predict the water concentration of the solution and the cell sap to be closest. A glucose content of about 30% seems just about right when I consider the consistency of sap in other plants. A little osmosis may occur in either direction, as the glucose content of cell sap will not be precisely 30%. Here I expect only very little weight gain or loss in the potato sample.
Beaker 5:
Beaker 5 is the only beaker in which I predict that the potato sample will lose weight. This time I expect the sugar solution to have a lower concentration than the cell sap, though only marginally so. As a result I predict that some osmosis will occur, the result being that the potato sample will loose weight and may even shrivel.
Obtaining Evidence
I carried out my experiment as detailed in the plan. I had to take note of safety measures, especially when using the scalpel to cut the potato samples to size. Accuracy too was important. The different sugar solutions were carefully poured out into the beakers in equal amounts, and each potato sample was measured and cut with a ruler and the same potato corer each time. Finally, to ensure maximum accuracy, the weight of each potato sample, before and after the experiment, was measured to 2 decimal places. The experiments were carried out over the same time period to give the osmosis plenty of time to occur in each instance.
For reliability the experiment was to be repeated three times. When it was actually carried out, one set of results was found to be anomalous, and so the experiment was repeated for a fourth time. My results are displayed in the tables below. The three sets of accurate results were averaged and are displayed in the final table. They are the final results from which I will draw my conclusions.
Accurate results:
Anomalous results:
Average Results (Weight Change):
Analysis
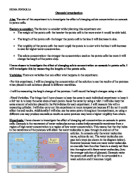
I plotted my average results into a graph (below) for ease of display. As the results may be continuous according to the exact percentage of glucose in the solution used, a line graph is most appropriate to display the data. Also, as the data collected is not accurate enough to form a clear line, I used a line of best fit to represent the data in a single line as precisely as possible.
Where the line of best fit crosses the horizontal axis on the graph, the value is equivalent to the strength of the sap solution within the potato cells. At this point on the line, the graph tells us that there has been no weight change. That is to say the potato has not gained or lost weight through osmosis. Osmosis will not occur only when water concentration both inside and outside the cell is exactly equal. This is because there is no imbalance in water concentration to correct. At this point the strength of the solution in the beaker is equal to that inside the potato’s cells. The graph indicates that the solution strength of potato cell sap is approximately 15%; 15% of the sap contained in a potato cell’s vacuole is glucose.
The graph also shows that the weaker the solution strength the higher the weight change will be. At the very lowest solution strength of 0% - pure water – the average weight change was a 0.69g increase, thought the graph’s line of best fit shows it to be approximately 0.6g. This is because there was a far higher concentration of water outside the potato cell than there was inside. Therefore, water particles from the beaker passed through the potato cell membrane to even out water concentration. Consequently there was a visible increase in the potato cell’s size as the vacuoles forced their cells to expand and become turgid.
The average weight change slowly falls from here on as the solution strength increases. At 10% the average weight gain was 0.28g, and the line of best fit shows it to be about 0.2g. Finally, as described above, at approximately 15% solution strength the average weight change is nothing.
The line displaying the average weight change now crosses the axis into average weight loss. The average weight change now increases again. At 20% the average weight loss was 0.36g and the line of best fit shows it to be about 0.2g. At 30% the average weight loss was 0.52g while it is shown to be closer to 0.6g on the line of best fit.
By the end of the experiment at 40% solution strength, both the line of best fit and the experiments’ average display a weight loss of 0.98g. Here the water concentration inside the potato cell was far higher than that in the beaker, and so water left the cell vacuole and crossed the cell membrane out into the beaker until water concentration on either side had equalled out. The result was a visible decrease in the potato sample’s size.
In my plan I predicted that water concentration inside and outside the potato cell would equalise at 30% solution strength. The experiment’s results however, when plotted on a graph, undermine this prediction by suggesting that concentration levels in fact equate at about 15% solution strength. The results imply that I over estimated the strength of the cell sap in the potato to be roughly twice what it actually is. I now realise that plants need proportionately less glucose than water than I had originally assumed.
I had predicted that the potato samples in the beakers containing solutions of 0%, 10% and 20% strength would gain weight. Meanwhile, that in the 30% strength solution would retain more or less the same weight, and that in the 40% strength solution would be the only sample to lose weight. In the actual experiment, only the samples in the solutions of 0% and 10% strength gained weight, while all others lost weight. Also, unlike my predictions, no sample retained an almost constant weight, as the strength of the potato cell sap equated with a strength of solution that I did not use in my experiment, but which fell between the solutions of 10% and 20% strength.
The experiment’s results however, do agree with my prediction as far as the overall pattern of weight change is concerned. From my scientific understanding of osmosis I realised that at the lowest solution strength the potato cell was certain to gain weight, and at the highest solution strength I used I predicted it would lose weight. Hence, my predictions followed the same sloping line as my results, from the highest weight gain at the lowest solution strength, through the axis to the highest weight loss at the highest solution strength. The fundamental reason for the differences between my predictions and the experiment results, was my inaccurate choice of the solution strength equivalent to that inside the potato cells’ vacuoles, at which no osmosis would occur.
Evaluation
I feel the experiment to have been overall very accurate in both the conduction of the tests themselves and the results. It made full use of the most precise equipment available, though it was left open to human error. The volumes of the sucrose solutions as well as the size of the potato samples were carefully measured to an appropriate degree of accuracy, as detailed in the plan. The concentrations of the different solutions were measured to the nearest percentage. Consequently, the results provided a graph clear enough to form a defined conclusion from.
All the results when collected together and averaged clearly placed the concentration of potato cell sap between 10% and 20% sucrose. As they seem to be sufficiently accurate, we can also trust the more precise figure of 15% concentration that the graph provides. This, the point where the graph crosses the axis, is the point at which the concentration of the sucrose solution is equal to that of the potato cell sap. Thus it is the conclusion to the investigation.
The results I finally used in my analysis were all more or less uniform, however during the investigation one set of completely anomalous results was obtained. These were left out of the averaged results. They were the first obtained results, and so the problems that caused their inaccuracies were corrected for the repeats of the experiment. When these first results were collected the time over which the samples were left appears to have been too long. When checked, the samples had grown mould or rotted, leaving them un-open to osmosis. Consequently the results were completely irregular.
The main improvement that could be made to the accuracy of the experiment would be the regulation of timing. It was poor timing that caused the anomalous results in the first experiment. The more tightly controlled the timing of the experiment, the more accurate the results are likely to be. Other than this, I feel the experiment that the experiment was well conducted. Perhaps in future though, the results of other pupils’ experiments could be pooled in order to obtain a wider and more precise base of evidence.
There is scope for further investigation of the topic in order to obtain further evidence and draw a more accurate conclusion. For example, now the concentration of potato cell sap has been identified at about 15%, a smaller range of solution strengths could be used in an otherwise identical experiment; 5 solutions of 10% and 20% concentration for example. Alternatively, investigations could be conducted into the effects of osmosis on different vegetables or more widely plants in general. For further information on the potato, the same experiment could be conducted using samples from different parts of the plant. This would establish whether different areas of a plant have differing levels of sucrose in their cell sap. Any of these suggestions would both help to support my conclusion and extend the investigation in general further.
Bibliography
GCSE Biology
D. G. Mackean
Biology for You
Gareth Williams
The Times GCSE Revision Guides – Biology
PC CD ROM
Hutchinson’s Multimedia Encyclopaedia
PC CD ROM