Resistance (ohms/ Ω) = Potential Difference (V)/ Current (amps/ A)
Temperature
The temperature of the wire can affect the resistance, as the temperature is higher, the metal ions of the wire vibrates more in a fixed centre, giving a higher chance for electrons to collide with the vibrating metal ions, so more resistance is created. On the other hand, if you decrease the wire and cause it to be extremely cold, the opposite effect occurs and the resistance will reduce to almost no resistance, therefore creating superconductivity.
Prediction
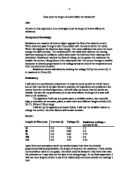
In this investigation I am choosing to investigate how the length of wire affects the resistance. I predict that as the length of wire increases so the resistance will also increase. This is because longer wire means a longer lattice structure containing more metal ions for electrons to collide, thus a less smooth flow occurs and more resistance is created. In figure 3, a predicted graph shows the relationship between length of wire and resistance. This shows that as the length of wire doubles, the resistance of the wire will also double, therefore showing how they are proportional to each other.
Equipment
Below is a list of equipment I need to carry out investigation
- Power pack set to 2V- power supply for the circuit
- 1 metre length of resistance wire- used to give different length of wire for the circuit
- Ammeter- used to measure current in the circuit
- Voltmeter- used to measure the voltage (potential difference) in the circuit
- 1 metre rule- to measure and adjust the length of wire
- leads (short x 3, long x 2)- used to connect the circuit together
- crocodile clips x 4- used to clip into the wire and adjust the length of wire
Planned Method
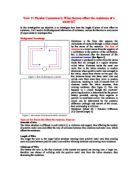
In this investigation, I will use the above equipment to make a circuit and use to investigate relationship between the change in potential difference and current and the length of the wire in order to calculate the change in resistance, in figure 4 is a diagram of my circuit.
By using an ammeter and a voltmeter in a circuit, I am able to measure the potential difference and current to calculate the resistance at different length of wire by using the formula: Resistance (ohms/ Ω) = Potential Difference (V)/ Current (amps/ A). I will need to have varieties of length of wire in order to make a fair test and to give more evidence to see whether my prediction is correct or not. Below is a table in which I will use to record my results in.
Fair Test
In order to make my experiment a fair test, I will need to consider the factors that can affect the outcome of my result and why I need to set certain factors in certain fashion.
Length of wire
In each experiment I will need to make sure the length of wire is accurate and for the specific experiment, (i.e. keeping it at exactly 15cm rather than 14/16cm), going up in scale of 15cm for length of wire will give me an even pattern for relationship between length of wire and the resistance, also, keeping the experiment’s results accurate and prevent it from giving me anomalous result. I will do this by using crocodile clips to clip onto the wire with the rule rather than using the lead into the socket provided on the rule, this is because if the wire are needed to be curled around the ends of the rule, the current will go through the curled part of the wire and thus affecting its length and giving an anomalous result.
Temperature
The temperature will need to be keeping in constant as I am not investigating temperature and its affects on resistance (higher temperature = higher resistance).This is because when the current flows, collisions between positive metal ions and free electrons happens, when the power is left on for longer amount of time, the number of collisions increases thus giving me a higher temperature. In order to maintain this, each time after the circuit is switched on, I will leave in on for 3 seconds every time and then switch off and leaving it off for 3 seconds, so that every experiment will have the same/ very similar temperature in the wire, thus just allowing me to investigate with the length.
Number of Experiments
I will need to do more than 1 experiment for each length of wire so that I can more data to calculate and use the average result for my investigation, and that my results are accurate and I can ignore any anomalous data.
Results
Below are the table of my results: (resistance are to one decimal place)
I will calculate the average resistance for each length of the wire
I have rounded the resistance to 1 decimal place as it is easier to plot on the graph, though I did not round up the figures for other data as it will affect the outcome figure for the resistance.
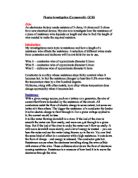
By using this result, I can make a graph and use it to show whether my prediction is correct or not. From the graph, (figure 4). I can see that my prediction is correct; this is because my graph of average resistance shows that as the length of wire steadily increase so will the resistance. Also, from the table of results I have previously, I can observe that all these sets of experiments have positive correlations, so as length I increases so will resistance. This means that as the length in creases, the lattice structure increase in length and will have more positive metal ions vibrating on the spot, thus there will be more collisions between them and the free electrons inside; creating more resistance. The straight ascending line shows that I have complete the experiment as fair as possible as other factors such as temperature does not seem to have affected my results.
Analysis
The graph shows confidently that as the length of wire increase so does the resistance. In my opinion I think I can confidently say that as the lengths of wire increases so will the resistance, this is due to the clear pattern shown from my graph above, as well as the fact that the line of best fit touches nearly every point. For example, resistance increasing from 1.7 at 15cm to 3.3 at 30cm. This shows that as length of wire increase, more ions are being collided by free electrons vibrating in the lattice structure, therefore giving a less smooth flow of electrons and a higher resistance. However, from the best line fit, it suggests that when the length is at 90cm, the resistance should be less than the actual result of 9.9 Ω. Also, there is no exact increase in resistance when the length of wire increases in scale of 15cm, such as increase of 1.6 Ω from length 15cm to 30cm, compare to increase of 2.0 from length 75cm to 90cm, though overall the increase of resistance is 1.5 or 1.6 Ω. This supports my earlier prediction that when the length of wire increases at a steady rate (increase in scale of 15cm), the resistance will also increase in a scale (for this case at 1.5/1.6 Ω), therefore suggesting that they are in proportion.
Evaluation
My method of approaching this investigation has been reasonably good, as the results I have suggests confidently that my prediction is correct, I have take care of other factors that will affect resistance such as temperature and thickness of wire by keeping them at constant throughout each experiment. Using the average resistance of all 3 experiments also gives my better result to analysis in as one experiment might be different from others due to similarly different length/temperature. This also gives me a chance to ignore anomalous data that might affect the outcome of the graph, though in this case all data are collected fairly and accurately.
To improve my experiment, I might consider doing more repetition of the experiment, (i.e. from doing 3 sets of the same lengths to 5/10), this gives me more reliable data as there will be less chance of anomalous data to occur and giving a better overall of the relationship between length and resistance. Another way I can improve my data is to take a record of the temperature of the wire and the room temperature every time before each experiment, this way I will know fore certain whether the temperature affected the outcome of the result.
I am not able to say that my prediction is 100% correct as I have only used one type of wire (nichrome), therefore I may only be able to say confidently that as the length of nichrome wire increases the resistance of it in a circuit increases. I will need to do the same experiment with a different wire in order to prove this. Also, I may investigate the resistance by using it in a parallel circuit rather than a series circuit like I have done in this investigation, as the current is split up in the circuit, which may affect the calculation of resistance. I may also investigate other length of wire (i.e. increase in scale of 5cm) to ensure that my prediction of whether the length for wire and resistance are in proportion and if my pattern is accurate and true for any other case.