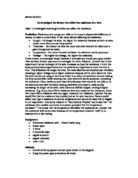
The above table is a sample of the tables that I am going to create showing the headings of the five columns that I will make in my tables. The first column is the voltmeter reading. The second column is the ammeter reading as we increase the voltage in steps of 0.1V up to 1V. The third column is the ammeter reading as we decrease the voltage. The fourth column is the average of the two ammeter readings and the fifth column is where we calculate the resistance using the formula R=V/I. We take two ammeter readings and find the average so that our readings will be more accurate. I will also draw a graph to record the readings the graph will be like this: From this graph and the formula 1/gradient we can see that steeper the graph lesser the resistance. I will draw similar graphs for the readings of different lengths, thickness and material.
For investigating length I will take five wires of different lengths like 5cm, 10cm, 15cm and 20cm but of the same thickness and material and then I will find the resistance for them make a table as shown above and draw a graph. The predicted graph will be like this:
In this graph the steepest line is the shortest wire (5cm) with the least resistance and the least steep line is the longest wire (20cm). The shortest wire has the least resistance as the electrons have to travel a smaller distance and so there are fewer collisions with atoms so the resistance is lesser and so the graph is steep. As the wires get longer, the electrons have to travel greater distances so they encounter more resistance and so the graph gets less steep.
For thickness I will take four wires of thickness 0.2mm, 0.4mm, 0.6mm and 0.8mm but of the same length and material and then I will find the resistance for them make a table as shown above and draw a graph. The predicted graph will be like this:
In this graph the steepest line is the thickest wire (0.8mm) with the least resistance and the least steep line is the thinnest wire (0.2mm). The thickest wire has the least resistance as the electrons have more free paths to flow through and the resistance is less and so the graph is steep. As the wires get thinner, the electrons have less free paths to flow through and encounter more opposition and so they encounter more resistance and so the graph gets less steep.
For material I will take four wires made of different material but of the same length and thickness. The material will be copper, aluminium, nichrome and graphite.
After recording the various ammeter and voltmeter readings in my tables I will then calculate the resistance and then draw up the graph which will look like this:
In this graph the steepest line is the best conducting wire (Copper) with the least resistance and the least steep line is the wire with the most resistance (Graphite). Copper has the least resistance as it has the most free electrons so there is more conduction and less resistance. Graphite has the least free electrons and so the resistance is highest.
I am going to use a series circuit to measure the resistance of two wires of the same length. The only changes to the circuit from the previous circuit will be that there is one more wire connected after the first wire. The circuit will look like this:
I will compare the results for the resistance of a pair of wires connected in series and a single wire of equal length.
After calculating the resistance for the two lengths of wires labelled L1 and L2 I will put a single wire of equal length and calculate its resistance. Also the combined length of the two wires will be the same as the single wire, labelled L. After comparing the results for resistance of both the single wire and the two wires together I found that the resistance of L is the same as the resistance of L1 + L2. This is because the numbers of atoms that oppose the movement are the same in both the pair of wires and in the single wire as they are the same length, thickness, material and temperature so the resistance is the same. A graph drawn for these results will look like this:
The bold black line represents the single wire L and the green line represents the pair of wires L1 and L2. As we can see from the graph, both the lines have almost exactly the same value and so their resistance must also be the same.
A circuit can also be connected in parallel and in the next diagram I have taken two wires of same thickness, length and material and keeping them at the same temperature I have then found out their combined resistance. Then taking another single wire with the same area of cross section as both the wires together and then found out its resistance and accordingly the resistance for both experiments is the same.
I also drew a graph of the predicted results:
As seen the green line represents the single wire and the black line represents the pair of wires and according to the predicted results the graph is almost exactly the same.
This is because single wire has the same area of cross-section as the set of wire connected in parallel. So same numbers of free paths are available for free electrons to flow through and so they have the same resistance.
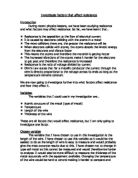
We then went and conducted a prior test. This test was so that we could familiarise ourselves with the apparatus and so it would be easier for us to conduct the actual experiments to collect the data needed. In my prior test I connected the apparatus as shown above in page and the wire that I tested had a length of 50cm and a thickness of 0.4mm and the material was nichrome. After conducting the experiment I drew up this table:
As seen in the table above I have calculated the resistance using my calculator and the formula R=V/I. I will now create a graph of I against V to calculate the resistance. First I will find the gradient of the graph and then I will calculate the resistance using the formula 1/gradient.
As seen in the graph above I have calculated the resistance which we can see is close to the resistance we got in the table.
The results for resistance that I got from the graph and from the table where very close and so it proves that my experiment was a success.
Length
Length: 50cm Material: Nichrome Thickness: 0.40mm
Length: 100cm Material: Nichrome Thickness: 0.40mm
Length: 150cm Material: Nichrome Thickness: 0.40mm
Length: 200cm Material: Nichrome Thickness: 0.40mm
Length: 250cm Material: Nichrome Thickness: 0.40mm
Thickness
Length: 50cm Material: Nichrome Thickness: 0.40mm
Length: 50cm Material: Nichrome Thickness: 0.56mm
Length: 50cm Material: Nichrome Thickness: 0.71mm
Length: 50cm Material: Nichrome Thickness: 0.91mm
Series Connection
Two wires connected in series
Length: (20cm + 30cm) Material: Nichrome Thickness: 0.40mm
Parallel Connection
Two wires connected in parallel
Length: 50cm Material: Nichrome Thickness: (0.40mm + 0.40mm)
From the length graph I then calculated it resistance using the formula 1/gradient. To do this I first calculated the gradient using the formula y2-y1
x2-x1
From the resistance that I got I then drew up this table for length affecting resistance.
We can also draw up a table to show the relationship of Voltage (V) and Current (A)
This table shows the voltage and current for a wire of 50cm and thickness 0.4mm made of Nichrome.
From these tables we can say that from my investigation we have found that as length increase resistance increases. We can see this in the first table as length increases from 50cm to 100cm resistance also increases from 5 to 10. This is proven in the free electron theory. It means that as length increases, electrons have a longer distance to travel and the longer distance means more atoms to oppose the movement of the electrons and so more the resistance.
We can also see that as voltage increases the current also increases. This is because the drift-velocity increases and drift-velocity is the rate of flow of charge. We also know that flow of electrons from the negative terminal to the positive terminal is the same as a flow of current because, a flow of negative charge to the left is algebraically equivalent to a flow of positive charge to the right. To prove that an increase in voltage will result in an increase in drift-velocity I have shown this example.
Let A be the cross sectional area of a conductor of length l having n no. of free electrons per unit volume. Let v be the average drift velocity of the electrons.
The volume of the conductor = Al
The no. of electrons contained = Aln
The free charge contained = Alne
The time taken to cover this distance = l/v
Therefore the rate of flow of charge is given by
So as we can see in the example as nAve (v being the drift velocity), increases, and current will also increase so we can say that Iv (drift-velocity). Also another thing that we note is that as voltage doubles, current also doubles so we can say that VI, I will discuss this in detail later on.
I can say that my experiment for investigating length was successful and my readings were quite accurate as we can see in the first table where it is seen that the readings from my graphs and from the table were the same. Also I can say it was successful because as voltage increases current increase and voltage is directly proportional to current and also as length increases, resistance increases.
The next graph is the thickness graph.
From this thickness graph I then calculated it resistance using the formula 1/gradient. To do this I first calculated the gradient using the formula y2-y1
x2-x1
From the resistance that I got I then drew up this table for thickness affecting resistance.
Also to show that my reading were accurate I have compared the area of cross-section of the wire against the resistance that I got. The area I calculated using the formula A=
As we can see that as area of cross-section increases resistance decreases. This is because as area increase there are more free paths for the electron to flow through so they find less opposition to their movement. This also means that as thickness increases the resistance decreases.
In this graph I have compared a wire of length 50 cm against a pair of wires connected in series of lengths 20cm and 30cm.
I have then drawn the conclusion that for x number of wires of length l, the resistance is the same as for a single wire with length l. This can be better shown in a table.
As seen the results are almost same. This is because the electrons in both the wires have to travel the same distance. The electrons have to travel 50 cm in both cases. So they experience the same amount of opposition to their movement in both the single and the pair of wires.
In the next graph I have plotted readings for a wire of thickness 0.56mm and for two wires connected in parallel of thickness 0.4mm each. From the graph we can see that the readings for both the single and the two connected in parallel are very close. This means that resistance in both is the same. This is because the area of cross-section for the single wire is pi x 0.28 =0.25mm and for the two wires it is 2(pi x 0.2) = 0.25mm
This means the number of free paths in both the single and the wire connected in parallel are the same. This can be shown in a table
As seen in the table the resistance in both the single and the pair of wires is very close so proving my point that if the resistance of x number of wires is taken and compared with the resistance of a single wire of which the cross-section is same as the sum of the cross-section of x wires then the resistance will be the same because the electrons will have the same number of free paths to flow through
As I have mentioned before that IV. I am now going to prove it mathematically.
The electric field strength at a point is the force experienced by a unit positive charge placed at that point.
We know that IE, as larger the electric field more the current, so we can say that.
IF/Q
Then
From the equation W =F x S (where S is distance moved) we can get the equation
F =W/S
So by replacing F in the equation IF/Q we can get the equation
IW/QS
To show current’s relationship to voltage, we must consider the equation
V =W/Q
rearranging which we get the equation
W =QV
We replace the Q in IW/QS with the above equation to get
IQV/QS
We can then cancel the Q from both sides to get
IV/S
In this equation, S is the length of the conductor and it is not changing. So we can say that
IV per unit length of the conductor.
We can also say that v(drift velocity) E(electric field). To prove this we must go back to drift velocity where I have made the statement
(1)vI
also as seen above
(2) IE
So by substituting (1) and (2) we get
I Ev
Also we can say that Vv as IV.
So IVEv
Note: Capital V represents voltage and small v represents drift velocity.
We have investigated the factors affecting resistance. We have seen how length and thickness affect resistance in a metallic conductor. Also we investigated how resistance would be affected if we connect the conductors in series or parallel. We did this by using the voltmeter-ammeter method. In this we measured readings of current and voltage from 0.1V to 1.0V at intervals of 0.1V. We then calculated the resistance through the formula R=V/I and reading from the graph of voltage against current and then calculated the resistance by using the formula 1/gradient.
I took a few precautions before conducting my experiment and now I can say that the precautions were justified as we can see in the table below. The table shows the resistivity of nichrome which was the material used to make the wires that we investigated. The resistance of a sample depends upon certain external conditions, chief of which is temperature. It also depends upon some physical properties of the sample such as the length and the cross sectional area of the sample. It is experimentally determined that the resistance of a cylindrical sample of conductor is directly proportional to length and inversely proportional to cross sectional area of the conductor.
Where is a constant which depends upon the material but not upon its shape and size and is called the resistivity of the wire.
Resistivity () of a material is defined as its resistance per unit length per unit cross sectional area of the wire. It is an intrinsic property of that medium and does not change with the shape and size of the sample. Units of resistivity are ohmmeter. The formula for resistivity is =RxA/L where is always a constant. The resistivity of nichrome is about m. To show that my results were reliable the resistivity of the wire used should also be about the same. In the table below I have shown some results I got for resistivity from some of the wires I used.
As seen the standard value and the calculated values are quite close showing that the resistance calculated for my wires was correct and hence the experiment was successful.
Although I have shown that my experiment was successful, it wasn’t perfect and there were a few errors. For example in the graphs that I drew, I made the line of best fit and some of the points were outside the line of best fit. There are a number of reasons that my results weren’t exactly correct. It could be because when I was measuring the voltage and current there could have been a few errors that would have affected my results. For example even though we kept the current at a low of only 1.5Amps the wire could still have slightly heated up and so increased the resistance. Also there may have been some lose connections which were not tightly secured. Another reason maybe because the wires that we investigated were wound round a nail attached to a board and the crocodile clips were attached to the nail so the amount of wire wound up was not taken into consideration. Also the sliding contact used to change the voltage was very bulky and not sensitive enough and so the readings could have varied. Also after changing the rheostat, the readings were not taken immediately and so the values could have changed.
To improve the experiment I could chose to investigate with a wider range of voltages. So that I would get various readings which I could compare easily. Also I could chose to investigate with a wider range of types of wires so to get a better idea of factors effecting resistance. For example I could investigate wires made of different material like copper. I would also investigate the resistance for more lengths and thicknesses. Also at different temperatures.
In the future I intend to do an extended investigation on the resistance in a filament lamp. In a filament lamp, as the voltage increase, temperature also increases. An increase in the temperature will lead to an increase in the resistance. That is why near the end the graph starts to get flatter because resistance is increasing.
I can implement what I have learnt from the investigation into real life. I have found out that thicker the wire lower the resistance and longer the wire higher the resistance. This can be used in a filament lamp. As for a filament lamp to work the wire inside it needs to be at a high temperature. To attain this high temperature we need to attain a high resistance. With the information that I have found out I can say that for the wire to attain a high resistance it should be long and thin, and as we see in filament lamps, the wire is thin and coiled up so to give a higher resistance.