Mass of ball: This is important as mass is directly connected to potential energy. The larger the mass, the more potential energy there is.
In this experiment I am keeping the same ball throughout so it will be constant as I am investigating the affect of height on speed not mass on speed. If I used different weights of balls I would have 2 variables so it would be hard to keep track of what I am doing and may lead to some incorrect results and it isn’t what I am investigating. If I had more time to do my experiment I might investigate the effect of mass on the speed of a ball off a ramp but unfortunately I don’t have time.
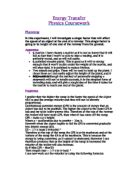
Friction: This could have huge affects on the speed of a ball, for example a trolley may accelerate faster down a ramp of smooth wood rather than on carpet, as carpet may provide greater friction for the ball rather than the smooth wood. Friction is the result of collisions of the object’s leading edge with air and collisions with the surface it is travelling over. The faster an object goes the more friction there is and the rougher the surface the object is travelling over the more friction is created. I will be using the same ramp for each test so there will be equal friction from the surface of the ramp. The faster the ball travels the more friction there will be from the air. I can’t eliminate this unless I did the experiment in a vacuum, as I don’t have a vacuum I will just have to do the test in normal air. This may cause a experimental error but it shouldn’t make a huge difference as all tests will be done in the same air.
Fair test
Fair testing is very important or there would be no point in doing an experiment because you would have a useless set of results. To make sure my experiment is a fair test I will:
- Measure the height of the clamp that holds the ramp at the same place every time. I will measure the distance off on the ruler within a mm so there shouldn’t be any great source of error here.
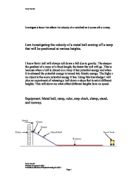
- Timing: I will start the stop clock as soon as the ball leaves the ramp and stop it as soon as the ball has covered 1.5m. This will be my greatest source of error as it is very hard to measure the exact moment in time very accurately of when the ball starts and stopped travelling along the runway.
- When releasing the ball it must be released from the same place each time or it will travel over different distances. If it is released from lower down it will have less potential energy to be turned into kinetic energy so will go slower, resulting in an unfair set of results.
- Also when the ball is released it must just be let to roll on its own accord. This is because if it is pushed it won’t be the height of the ramp that effects the speed it travels down the ramp, it will be the force that it was pushed with plus the height of the ramp that will affect its speed.
If all this is done correctly I should get a good set of results that will be as accurate as I can possibly make them.
I will put all results in a table like the one below. The first column has the height of the clamp that holds the top of the ramp. This is measured in cm and the distance is taken from the bottom of the stand to a constant position on the clamp. The second column is for the results that I collect. I will put in all results then mark any odd results I have. They are all recorded in seconds. The third column is an average of all results. To get this average I will add up all the results I have for that height then divide by 10 (as that is the amount of results I will have). This will also be in seconds as it is using the results I have collected which will be in seconds. The last column is average speed. This is found by dividing the distance the ball travelled by the time it took as Speed = Distance/Time For this test the ramp was 1.5m, so it will be 1.5m/average time This will be in meters/second as the distance is measured in meters and the time is measured in seconds.
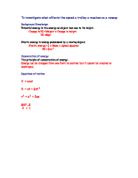
In this experiment I think that the higher the ramp is the faster the ball will go as there will be more potential energy to turn into kinetic energy. More kinetic energy is a faster speed. As I am measuring the speed of the ball, changing the height of the ramp will change the speed. I know that the higher an object is, the more potential energy it will have. This is because Gravitational Potential Energy = Mass x Gravity x Height
Height and potential energy are directly related, if the height doubles the potential energy doubles. The more potential energy an object has, the more kinetic energy it will have when it is released. The more kinetic energy an object has the more speed it has. There is a direct relationship between kinetic energy and speed. It is Kinetic Energy = 1/2 x Mass x Velocity2
In this equation if the speed doubles the kinetic energy quadruples.
Kinetic energy and Gravitational potential energy are equal:
Gravitational Potential Energy = Kinetic Energy
Mass x Gravity x Height = ½ x Mass x Velocity2
These two can be re arranged to give velocity:
Velocity2 = 2 x Gravity x Height
This means that I can estimate the velocity the ball will have before doing the experiment. This estimate may not be accurate because there are many other factors that affect the velocity of a ball but it does give me a general idea of what to expect.
Before I planned this experiment I did some preliminary work and sorted out the heights I would use for the ramp. I didn’t choose too many as I wouldn’t have time to do all the tests but I needed a good number to see the effect of height of ramp on the speed of a ball. I also sorted out that I would use a runway of 1.5m. I chose this length as it will be long enough to give a good set of results and it should be easy to measure the time. If it was a very short ramp it would be very hard to measure the time a ball took to cross it, yet if it was a very long ramp it would give a more accurate time but would mean that the ball may slow down when crossing it so wouldn’t give a very accurate result of the speed gained by rolling down the ramp.
I took some information for my plan out of ‘Physics for you’ by Keith Johnson.
Results
Analysis + Evalation
I can say from my experiment that the speed of the ball did increase with height. You can see this from the graph. On my graph I used a line of best fit. This means that it may not go through all the points but it should be quite accurate. A line of best fit will make the most use of the information that I have as it will let me see the trend of the speed and it won’t include any calculations that might be wrong so it will be accurate.
My graph is a curve. It starts steeply then levels off a bit but not by much. This shows that the speed of the ball does increase with the ramp at greater heights. The reason that it rises steeply then tails off is because it would rise steeply all the way up but it reaches terminal velocity for that height early on so doesn’t use the full length of the ramp to gain more speed. The graph will stop rising up when the ball reaches overall terminal velocity, at this stage rising the ramp even higher still won’t have any effect on the speed it will always be the same constant. Within one test the speed changes, it will start slowly then as it progresses down the runway it will accelerate to a greater speed. This meaning in some tests the ball may not have gained all its speed at the end of the ramp and in others it will reach its overall speed early on and just be travelling down the remainder of the ramp at a constant speed. The slower speeds will also be effected more by friction as there will be a constant amount of friction produced by the ramp, but if a ball is moving faster it has more force to overcome the friction.
In my prediction I said that: ‘In this experiment I think that the higher the ramp is the faster the ball will go as there will be more potential energy to turn into kinetic energy.’ This has been proved in my graph. My graph of results didn’t quite match the calculated results, this because I didn’t calculate friction into my results. The reason that my results start further away from my predicted results then get closer at the end is because at a slow speed there is a higher amount of friction in proportion to the force of the ball moving. At the higher speeds it is easier for the ball to overcome the friction so it doesn’t make as much difference to the overall speed of the ball. Even though, my results match the curve of my predicted results quite well.
I think my method for this experiment worked well as I got a good set of data that showed me the answer to what I was investigating. All my results were quite consistent apart from the odd one or two. Even thought these were not drastically wrong so I still included them in my overall results, as they didn’t make much difference that would be notable. With no friction my results would have been identical to the predicted results, so as the ball overcame friction it tended towards the predicted results so this is why the last two results didn’t fit onto my line of best fit. All my other results fitted the line almost exactly. If they were off the line it was only by about 0.04m/s off which isn’t a very big difference. This may have been from scientific error that I couldn’t control or the fact that my line of best fit may be wrong.
In my experiment the length of the runway was always constant so there shouldn’t be any error due to that, all the heights of the ramp were measured to the up most accuracy with the same ruler each time and to the same point on the clamp. The ball was kept constant, as it was the same each time. The only thing that could have a large amount of error is the fact that it was very hard to judge when the ball started down the runway and when it stopped travelling down the runway. The ball was released from the same point each time and it was never pushed just left to roll. The ramp used was the same each time so there will have been equal friction from it unlike if two different ramps were used, one with a polished surface and one with sandpaper on.
I think that my method gave me reliable results as they were quite close to my predicted results and as I did 10 tests for each height and all the results were quite similar for that height. From this I can say that my results are quite accurate. But they will never be as good as if I had done the test under strict laboratory conditions with better equipment, this would create a even smaller source of error.
If I had to redo this experiment or investigate it further and I had more time I would do more tests on different heights and do more tests for each height. This would mean I would have a more accurate set of averages and more of them to draw a graph from so I would get a better line of best fit. Using more heights would show me at what height the ball reached terminal velocity and it would make the top of my graph level off more. My method worked really well, I found out that height does affect the speed of a ball, so I wouldn’t change that. To find out what really has the most effect on a balls speed I could do more tests using the same method but changing some of the variables, for example mass of the ball or length of the ramp.
Also if it were possible I would use a light gate to measure the time it took for the ball to travel down the runway. This would eliminate the timing error which without special equipment is very hard to control.
Anna Vaudin
Physics Coursework 2001
Anna/School/Science/Physics/Investigation2001
Page