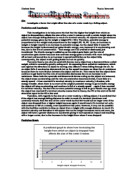
Pre Test Graphs
Full Apparatus List
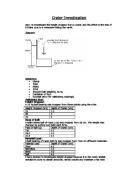
To carry out the experiment the following things will be needed:
- A ball of plasticine – weighing 200g
- A roll of cling film that can be torn into strips
- 150ml of water in a beaker
- 2 clamp stands
- A metal tray full of sand (about 500g)
- A small rule with millimetre measurements for measuring crater depth
- 2 large meter rule for measuring heights
- Access to chairs and benches for dropping the object from higher heights.
Plan
- Firstly, get all the equipment together, and then take the tray of sand and pour onto it the 150ml of tap water from the beaker. The sand needs to be quite firm but not so water is accumulating on top, dampening the sand is too ensure that the shape made by the crater will stay engraved in the sand once the object has been removed for ease of measuring and accuracy purposes.
- Take a clamp stand and set it up next to the tray with one of the large meter rules clamped vertical from the height of the sand surface (not the floor because the sand is the point of impact and heights can be measured more accurately without the need for someone to hold the rule in place.
- Draw up a table for collecting the data.
- Do the first test, start by placing the tray of sand on the ground and covering the surface of it with a sheet of cling film do not stretch or pull tight because this will effect the movement of the ball and the crater made which will spoil the results.
- On the rule find 0.5m and drop the ball from this point (do not throw or exert a force in anyway because this will distort the results when the aim is just to investigate a falling object.)
- Carefully remove the object and measure the depth of the crater made with the smaller ruler in cm and mm. Make brief notes on other observations noticed such as if any sand is propelled out of the tray on impact to try and explain later.
- Repeat the experiment increasing the height each time by ½ a meter from 0 to 2.5m for the larger heights Put another clamp on a bench and fix the second meter rule above as a continuation of the first, use the necessary chairs and benches to for dropping the object.
- Make sure that there are enough results to be able to analyse and draw graphs from.
- After each test replace the sand to a flat position, if the object has changed shape in any way try and fix this but most of all check that it hasn’t changed in weight and if it has make the necessary changes so that the weight of the object is always the same each time (200g) for a fair test and accurate results.
- Repeat results three times at least starting from 0.5m again in order to calculate an average.
Tip: For safety reasons be careful when using all lab equipment. Even though this experiment is not really dangerous be careful in the lab area, do not mess around with water or sand as it my get into someone’s eye, cling film can also be dangerous due to a risk of suffocation.
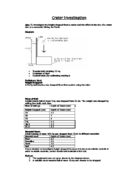
Method
The method followed the plan almost exactly except that the water added to the sand to make it firm and hold the shape of the crater was reduced from 150ml to 100ml as the sand was already quite damp and the 150ml amount was decided based on dry sand such as in the pre test. It was cut to 100ml as not to affect the results by having water accumulating in the craters, which would prove difficult for measuring.
Results Table
Analysis
Both graphs have strong, positive correlation showing that the height from which the 200g object was dropped from and the depth of the crater it makes are proportional, therefore, as the height increases so does the depth of the crater. The intervals at which the depth of the crater increases at each ½ m varies from only a small increase at the lowest and highest heights, to a large increase at the heights in the middle about 1-2m. From 0.5-1m the increase in the size of the crater is only 6mm; yet, from about 1m through to 2m the increase doubles to about 10mm each time but then again at the last height from 2-2.5m it drops again to only a 5mm increase. Both graphs A and B follow this pattern, however both show strict lines of best fit, graph A shows a line of best fit that goes perfectly through the results at the extremities (e.g. lowest and highest heights) and has an interval increase of about 5mm. Whereas, graph B shows a strong line of best fit though the middle results (e.g. 1-2m) with an interval increase between the results always around 10mm. The results at the higher heights on graph A would be less on graph B and the results at the higher heights on graph B would be less on graph A. It seems that a graph in between these two graphs would be a more accurate reading of the results and the intervals of increase would be the same each time, the two graphs drawn are another way to show the error in the results such as the percentage error due to the fact that more than one line of best fit could be followed showing different anomalies. Out of the two graphs however, graph A is probably the most accurate with the results that lie on that line only having a percentage error of about 5-6%, whereas, the results that lie on line B have percentage errors ranging from 6-15% again, this is the middle results which have the largest interval increase between them.
The results follow the prediction and predicted graph almost exactly up until a certain point. An increase in the height resulted in an increase in the depth of the craters this is because all objects have potential energy, which is proportional to our dependent variable the height because the PE=W x H, therefore potential energy is also proportional to the weight, yet this variable was not investigated. As the object falls, obviously the height is decreased resulting in a loss of potential energy which becomes kinetic energy due to the law that energy can never be crated or destroyed and also the fact that the object is moving and accelerating. Overall, the higher the object is dropped from the more PE and then KE it has so the more it accelerates and faster it moves, the more energy it has on impact and the larger the crater – this was what the experiment helped to prove.
However, the prediction also expected something else to happen which the results did not support. It was expected that if the object had enough falling distance to reach it terminal (maximum and constant) velocity then from then onwards regardless of the heights increasing the crater would stay the same size as the object can not fall any faster. This prediction was made because as an object falls the kinetic energy is added up causing the object to get faster yet, each time less and less of the original PE goes to KE and more to heat and sound due to the increase in speed and friction on the accelerating object, meaning that the object does get faster yet not as quickly. Likewise, with forces as the object accelerates and increases in speed, the air resistance acting against it also increases, again due to an increase in friction between the object and air. Therefore if the object has enough falling distance to accelerate to the point when both forces are balanced then it will stop accelerating and continue at a steady speed, the rate of acceleration being 0m/s2. With regards to energy transfer, this means that no more of the original PE is left to go to KE meaning that the object can not accelerate any more and will just continue to fall at its terminal velocity. Briefly this means that if an object has enough falling distance to reach its’ terminal velocity, after that is reached it does not matter how much higher it is dropped from because after a certain distance it will reach its terminal speed meaning that the crater size will not be affected after that height has been reached and any height above that. It is possible that the experiment did not support this theory due to the limitations of the evidence; the predicted graph shows the results taken from heights ranging from about 0-12m, yet in the actual experiment the largest height facilities would allow was only 2.5m, which is much less. It is possible that the 200g object used in the experiment did not have enough falling distance in the heights used to reach its terminal velocity and terminal crater size, therefore, the reason why this did not show on the graph. When comparing the investigation graph and the predicted graph it is evident that the investigation graph only makes up a small area of the bottom, right hand corner of the predicted graph at which point it relates to the predicted graph numerically and almost exactly. The graph in the investigation is cut off here as facilities would not allow the test to be carried out from any further heights, yet, the predicted graph goes on in the same fashion as the investigation graph started until it eventually flattens out and tails off horizontally at the predicted point when the object has enough falling distance to reach a terminal velocity. It is most likely that if the investigation could be continued to higher heights then the graph would eventually show the heights beginning to tail off as the object nears it terminal velocity. Therefore the investigation has not proved the prediction wrong but instead only helped to prove a certain part of it that was possible to test, the rest would take further investigations and higher facilities.
Another limitation noticed was the weight of the object that had to be used, it is possible that a lighter weight object would reach its terminal velocity quicker due to the fact the PE is also proportional to the weight meaning less would go to KE and the energy transfer would take place in less time, so therefore the rate of acceleration would decrease faster. There would also be less air resistance needed to balance the force of the weight so overall the terminal velocity of a lighter object should in theory be reached in a shorter distance. It was discovered in the investigation that it was not possible to use a lighter weight object due to the fact that the crater it made was not of sufficient size for measuring and proved difficult. Yet, it is possible that if there was a way to measure the crater made by lighter weights then they might have enough falling distance at much lower heights to reach their terminal velocity and back up the rest of the prediction. Again, the prediction is not disproved just not fully supported due to various limitations throughout the experiment.
Evaluation
The investigation as a whole was a success and provided results good enough to analyse and plot graphs from, however, the reliability of the results is questionable and the experiment was not entirely suitable to be able to asses the whole of the hypothesis and prediction which would have been the aim. This is due to errors that have occurred during the method, some systematic that couldn’t be helped and some just random that could be with more care and attention. Many systematic errors occurred which meant the investigation was limited, for example, the range of heights with the highest height being only 2.5m meant that the investigation was not suitable to assess the prediction due to the fact that it was predicted that the object would eventually reach a terminal velocity. This was not disproved or supported because the range of heights was just not big enough, it is possible that if facilities would allow the experiment to be carried out from higher heights then maybe the results would show the object finally reaching a terminal velocity or not and then maybe either disproving or supporting the prediction. Another systematic error that occurred was the limitation with the weight of the object used, the preliminary test showed that any object under the weight of 200g did not make a sufficient crater to be able to measure and collect results from, therefore the weight of the object was set at 200g. However, if it had been possible to measure the depth of craters made by a lighter object then maybe the results might have supported the prediction more, due to the fact that lighter objects in theory reach their terminal velocity in much less falling distance than heavier ones. The problem of not being able to measure craters made by light objects could be combated by changing the material that the object is dropped into. In the investigation sand was used which is quite dense and heavy, may be a softer substance would have worked better such as finely powdered cement or talcum powder which are both more easily compressed and with just a small amount of water would hold the shape of even quite small and light objects. Another error which again is systematic is the actual equipment that the sand was held in, the trays used had a depth of about 3 inches and it was found especially in the tests from higher heights that the craters were almost this depth so even if an object was capable of producing a larger crater it could not because it had already reached the bottom of the tray. The sand would also have been compressed after each test again making it harder for the object to produce a larger crater in the next test as the sand was so tightly compacted. A possible way to combat this would be to use trays that are much deeper do that the object can not possibly create a crater that would be the depth of the tray and be limited by it, this would also reduce the effect of the sand being compacted which would matter less if there was more sand because only that at the very bottom would begin to be compressed, therefore have little to no effect on the results. Not only systematic errors occurred but random ones may also have done as well, random errors such as the measurements of the heights not being exact or the object not being dropped at exactly the right point at that height the measurements of the crater being read wrong or possibly even the weight or shape of the object being just out due to the repeated testing. Although every care was taken to measure the heights exactly using clamp stands and metre rules it is possible the measurements were slightly out which could have moved all the results down or across just by a fraction and suggest a different analysis of them. The shape of the object as it was plasticine could have changed after each test due to the impact when it hit the sand, which might have meant other depths were recorded with the object in longer shapes possibly distorting the results by making them larger such as the larger increases from about 1-2m. A way to combat this would be to use a solid object such as a golf ball that is not pliable although this may cause other limitations if the weight of it needed to be changed whereas with plasticine you can always just add some then take some away to get the perfect weight.
Finally, many further experiments could be done to provide additional evidence to extend the enquiry and help to prove the rest of the prediction and the idea of a terminal velocity. The object could be dropped with a parachute attached which would increase the air resistance acting on it, therefore the air resistance and the weight should become equal at a lower height when acceleration stops and the object should reach its’ terminal velocity quicker. Increasing the surface area of the object will also help to increase the air resistance having the same effect as dropping the object with a parachute, however, a flat shape would make it harder to measure the depth of the crater especially if it is thin so if that option is chosen then it may be a better choice to measure the diameter of the crater instead. Although a pre – test would still need to be carried out to determine the best variable to measure and the equipment and method to be used. The other final option that could be done is dropping the object through water, which is much denser than air, the object will displace the water creating up thrust and because water is so dense the up thrust will be greater than air resistance in air. Both forces will increase at the same rate until they are even when the object will continue to move at a steady speed and stop accelerating, because the up thrust is greater than air resistance this should happen sooner and from a lower height, therefore it will be possible to see if the object reaches its terminal velocity and then to try and make an estimate of the height at which the object will reach its’ terminal velocity in air by calculating how many times denser water is than air and then multiplying that answer by the answer for the terminal velocity. There are however, many possible problems with this experiment, for example, it would be difficult to measure a crater depth or diameter yet, a possible way around this might be to measure the speed of the object with a small speed sensor just before impact at various heights with an aim to see if the object finally stops accelerating and always hits the bottom at the same speed, thus meaning it has reached its’ terminal velocity.