If the wire’s temperature rises, the atoms vibrate more around fixed points. There is then more chance of the electrons running into the atoms; so more atoms will be hampered. Therefore, the wire’s resistance will increase.
Factors that affect the resistance of wire
Aim: I am going to investigate factors that affect the resistance of wire:
Introduction
The following factors affect the resistance of wire: -
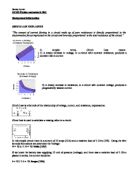
Thickness of the wire – affects resistance – a thinner wire would have most resistance, as there is less room for the electrons to move.
Type of metal – each type of metal has a different arrangement and number of electrons in its valence shell. There are positive ion cores, which form obstacles for the electrons as they travel through the wire – the type of metal will dictate how large/close together these ions are and this will affect how difficult it is for the electron to travel through the wire, and hence affects resistance.
Temperature of wire – increased temperature causes the ion cores to vibrate vigorously, which makes it harder for the electrons to pass and increases resistance.
Length – affects resistance as the electric current has further to travel along the electrons, Ohms law state that if the cross section of a wire is constant then the resistance is proportional to the length.
Prediction:
My prediction is that the thicker the wire the smaller the resistance, I believe this because when the wire is thicker there will be more delocalised electrons so electricity can flow through it easier. I base this prediction on my knowledge of Ohm’s law: “The amount of current flowing in a circuit made up of pure resistances is directly proportional to the electromotive forces impressed on the circuit and inversely proportional to the total resistance of the circuit. For my prediction to be correct, I would expect the amount of resistance to decrease as the cross sectional area increased.
Planning experiment:
Procedure:
In my experiment I will:
- Connect crocodile clips to 100cm of wire,
- Using the battery pack I will pass electricity through the wire,
- Measure the current through the wire with an ammeter,
- Measure the voltage across the wire with a voltmeter,
- Calculate the resistance R=V/I (R – resistance, V – voltage, I – current)
- Repeat this for the different lengths of wire.
- Repeat for the different cross-sectional areas.
Variables:
What things might affect the results (variables)?
- The temperature of the surroundings
- The type of metal the wire is made from
- The cross sectional area (thickness) of the wire -lengh+area
- Length of the wire
The variable that I will investigate is the length and cross sectional area, I will keep variables 1 & 2 constant.
Fair test:
To make this a fair test I will keep the type of metal and the temperature the same. The reason why I will keep the type of metal the same is because as we have seen the metal types influence resistance as does different temperatures.
-
Reliability - I will keep the number of batteries the same.
-
Reliability - I will need to make sure there are no kinks in the wires.
-
Reliability - I will need at least 5 results to plot a good graph. I am going to collect 1 preliminary set of data so I know what the results to look for, whether the volts go down, stay around the same etc.
-
Accuracy – I will use a 0 – 5A range on the ammeter.
-
Accuracy – I will use a 0 – 6-volt range on the voltmeter.
-
Accuracy – I will measure the length of the wire accurate to I decimal place.
The Hazards:
While doing the experiment I could incur some hazards they are: -
The wire could get hot so I shouldn’t touch it with bare hands and a heatproof mat must be placed under the wire.
I could short-circuit the battery pack so I should only leave the circuit on for a short time and use a relatively low current.
Displaying results:
I will use diagrams.
I will display both sets of results in tables and graphs working out the average current and resistance (ohms),
To find the resistance I will divide the voltage by the current: R=V/I
I will then work out the resistance/cm by dividing the resistance by the length.
Apparatus list:
Wires
Meter ruler stick
Crocodile clips
Wire of various cross section areas – 5 wires range of cross section areas: 0.007 – 1.500
Amp meter
Voltage meter
Battery pack
Diagram:
Ruler Metal wire
Wire
Amp meter A
V Volt meter
Battery Cells
Method:
Firstly I will collect all the apparatus on the list, then set up the equipment as shown in the diagram. To ensure an accurate test I will follow the instructions I have set out in my procedure and ensure I adhere to the safety rules. I will record the results from the ammeter and voltmeter straight away so I don’t forget them, and repeat this for all 5 lengths of wire and then repeat to make sure results are constant. I will record the results in table form. I will repeat this for all the other wires with different cross-sectional areas. Once I have finished all the tests I will transfer my evidence onto graphs to enable me to analyse it.
Preliminary results:
Cross- sectional area: 0.0573mm
After looking at these results and those retrieved by the class I find that the preliminary results of all students appear similar therefore, my method seems to be appropriate for this experiment.
There are some general trends that occur in the preliminary experiment that I should look for when collecting results, so I know my data is accurate:
- The voltage stays almost the same
- Amps (Current) start low then gets higher
- Resistance starts high and gets lower as the length of wire becomes shorter.
I found some things hard in the preliminary experiment therefore, I will make changes to some areas of the experiment, and these changes are:
- To ensure both my partner and me are present - this will make it easier to records results and enable us to stand in one place doing our own jobs, we will also be able to check each others work to ensure accurate results to ensure the tests are precise and the results are reliable.
- To wait until I have recorded all my results before I start working things out as I may miss or confuse a reading.
- I will only consider the results for one variable: cross sectional area.
Obtaining evidence:
I used the equipment as set out in my plan, in conjunction with the rules of the science lab, e.g. not having wet hands when handling electrical appliances. Other precautions I took were to make sure I did not expose myself to the known hazards stated in my planning, e.g. not to hold the wire with my bare hand when the wire is connected to the circuit. I did this by ensuring the experiment was carried out sensibly and in a safe environment. My method seemed to be sound no modifications were required; by carrying out the procedure with precision I ensured that I recorded accurate results. I was careful to double-check my readings and I did this by asking my partner to check my readings on a regular basis. If I was unsure of a result I redid the test to make sure I had read the equipment correctly.
Formulae used when recording results in my table
Resistance = Volts/Current (R=V/I)
Resistance/cm = Resistance/length (ohms/cm)
Average diameter: 0.1 Cross-sectional area: 0.007
Average Diameter: 0.18 Cross-sectional area: 0.030
Average diameter: 0.48 Cross-sectional area: 0.180
Average diameter: 0.87 Cross-sectional area: 0.590
Average diameter: 1.4 cross-sectional area: 1.500
Analysing and considering evidence:
The evidence shows:
The current is generally stronger when there is a bigger cross-sectional area; it also increases, as the length of wire gets shorter. The resistance lessens as the cross-sectional area increases. As the cross-sectional area is reduced the greater the resistance/cm, encountered by the electrons, this is due to there being a greater area for the electrons to move in, the electrons will encounter less obstructions on their journey through the wire, however as the cross sectional area decreases the electrons are more likely to collide with the atoms so slowing the flow off the current. This supports the prediction I made at the start of the experiment that the resistance would increase as the cross sectional area decreased. There is less resistance as the wires length decreases. Generally as the length gets shorter the resistance/cm gets larger, this is due to there being less room for the electrons to move and collision with the atoms is more imminent.
What my graphs show:
My graphs show the relationship between the cross sectional area and resistance. (Resistance/cm/cross-sectional area) Resistance/cm is higher when there is a lower cross sectional area. My graphs show that as the area increases the resistance decreases. I used the first set of results I got for each wire, as my results were similar for both tests, if the results were not similar I would carry out a further test and then take the average reading from the combined results. Each graph shows that the line of best fit on the graph started of high then went low, this is what I would expect with the prediction I made. There was a big difference between the smallest cross sectional areas and the biggest; (this was due to the thinnest wire being nearly four times thinner in diameter than the next thickest wire, and the thickest wire being nearly three times the diameter of the next wire) the points in the middle were very close together.
Conclusion:
In conclusion I discovered that the current is effected, it is weaker when there is a thinner cross sectional area and higher when there is a thicker cross-sectional area; the greater area allows more space for the electrons to travel through the wire thus creating a lower resistance as the electrons are less likely to collide with the atoms. This evidence supports my prediction completely proving that the greater the cross-sectional area the lower the resistance. My graphs and the tables support this. I have summarized this by recording the averages of all my results on the following table and graph.
Summary Table and Graph
Evaluation:
Checking the prediction
I believe that I obtained a high quality of evidence; this is supported by my readings appearing to be reliable as the shape of each graph is similar and matches what I would have expected to see if my prediction was correct. By presenting an average of all my results in both table and graph form I found the prediction I made was true, therefore, I believe my results to be reliable. There were no anomalous readings if there had have been I would have repeated the test for that variable and checked with other members of the class to see if they experienced a similar finding. I would have checked that no outside influences contaminated my result.
Accuracy and reliability of readings
The pieces of equipment I used to measure my readings was very reliable, I did find that if I turned the meter to face me I would have to wait for the meter to settle again before taking the reading as movement caused the meter to jump. Working in pairs helped to ensure the accuracy of the readings as we could double-checked each others work. If I forgot a result before I had written it down I would re-do the reading to make sure the recorded information was accurate. I chose a good range of wire diameters to ensure reliability of results.
What went well and what didn’t
With the method I used for my experiment some things worked well whilst some things didn’t.
What didn’t go well: the crocodile clips weren’t accurate to the exact millimetre there wasn’t a more accurate, easier and efficient way to do it, but as we used the same clips for each test, this should cancel out any slight inaccuracy. The hardest thing about taking the readings was when the meter wasn’t facing you and you turned the meter to face you it would jump and you would have to wait for it to settle again.
What went well: the wire being attached to the ruler enabled us to be exact with our measurements, and it saved time, as we didn’t need to keep re-measuring the wire. Working in pairs helped as one could keep putting the wires at different lengths whilst the other could record the results, also we could check our accuracy.
How I would improve the accuracy and reliability of evidence:
- I would put a weight on the end of the wire when it is on the ruler to make sure the measurements are exact.
- I would make sure I recorded the result straight away to save having to redo them.
- I would make sure that when I set up the experiment the meters were in an easy to read spot so that the meters didn’t need to be moved.
- I would make sure I stayed in a pair as you can have different responsibilities, which gives you twice as much time to carry out the experiment.
- I could use a data logger, as this is more accurate it measures digitally through a computer.
- I would use a wider range between each diameter to enable me to plot a more accurate graph.
If I was going to prove that the relationship would hold for every thing I could use a different type of wire, I could do it at a different temperature and I could also do different lengths of wire.