The reaction rate, however, should decrease as the experiment progresses because as the reaction time increases the number of hydrochloric acid molecules present will decrease as they have been reacted to form water calcium chloride and carbon dioxide. The additional water and calcium chloride present as the experiment progresses should decrease the rate of reaction because of decrease in concentration. This should make a graph of the reaction curved as the reaction rate slows down.
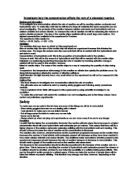
The increase in the concentration should be directly proportional to the increase of the reaction rate at a given time. This is because by doubling the number of hydrochloric acid molecules present the chance of a collision should be doubled, as there is now twice the possibility of a collision-taking place initially. This can be thought of as like people in a refined space, if there are twice the number of people there will be twice the chance of people colliding. This situation may change over time, however, depending on the situation.
This shows how a higher concentration produces more collisions.
Activation energy should not be changes in this experiment though as the same amount energy will be required to break the bonds. This is because each particle has the same amount of energy the only reason the reaction is faster is because there are more particles. This means activation energy will not have an effect on this experiment.
Measurements
To make this experiment a fair test we will keep all values we are not investigating the same. To decide on the values of variables we will keep the same we have carried out preliminary experiments.
The first preliminary experiment we carried out was to find the mass of chips to use and this experiment was also used to test the range of concentration to use in the experiment. These experiments were important to carry out because we could make sure the reaction did not fill up the cylinder too quickly leaving many times blank as the cylinder cannot contain all of the gas. This could also make sure the reaction did not take place too slowly to give us a small range of results.
To carry out the experiment we used a gas syringe and timed how long it took for the syringe to be filled. The volume of the syringe was one hundred cm³. We reacted both of the reagents in a conical flask and measured the mass of the chips on a electronic balance to get a fairly accurate reading.
Our results are shown underneath.
From this we decided the best mass to use was 7.5 grams this was because this reaction took place at a reasonable rate because it was fast enough to get a wide range of results but anything faster would make the experiment hard to record as the cylinder would be filled too quickly.
We also found from this these were the best range of concentrations to use because the times were the extremes were high enough and low enough to get a wide range of results.
The values of all the other variables are:
Equipment
100cm³ Conical flask- this will be used for the reaction to take place because it is large enough to hold the reaction
Measuring cylinders- because these are different sizes so it will enable us to measure higher volumes
Clamp- this will help to help the hold the cylinders so we can concentrate on recording the results
Container- we will use this to put the cylinder of water upside down in so water does not spill
Delivery tube- this will be used for the gas to travel down and will be useful because we will not have to hold the conical flask.
Stopwatch- this is needed to measure when the volume of gas needs to be recorded.
Range of numbers and readings
In this investigation we will be recording the volume of gas every twenty seconds because this was a suitable time interval for finding a measurable change to take place. The time we will be measuring this experiment for is two minutes because this gave us enough data for us to draw an accurate graph and we would not have to wait too long to complete one experiment. This gave us time to repeat the experiment three times so we would have more accurate averages. We will be measuring the cylinder to the nearest cm³ because this is how often the cylinder is marked so this is the most accurate we can get. The time will be measured o the nearest millisecond we will not be able to record the volume at exactly this time though so we will probably measure the time to a two second accuracy.
Method
To make the test a fair test we had to carry out the same method each time this is what we did.
First we filled the tub with tap water about half way up and filled the measuring cylinder with water and then turned the measuring cylinder upside down into the tub of water so the cylinder was still filled with water. By doing this we did create a slight margin of error because some of the water was displaced when doing this although it was very little. Then we clamped the measuring cylinder in place. We changed the size of the cylinders, however, this did not make the test unfair. We then put the delivery tube under the cylinder so the air from the experiment could displace the water. To make sure the volumes of acid and water were right we now measured the volumes of each in a measuring cylinder to be accurate. To make sure the mass of marble chips were right we measured on the electronic balance to one decimal place. Then we put the chips and the acid in the conical flask and started the stopwatch.
As the experiment has started we now recorded the volume of gas every twenty seconds. We did this until two minutes had elapsed. We then changed the mass of the chips and the concentration of acid until we had all the data that was required. While doing this experiment we had to work carefully to avoid accidents and follow safety procedures.
Underneath is a diagram of how the experiment was set-up
To find out information for my investigation I used the resources listed below.
Internet- www.about.com
www.excite.co.uk
Books- Nelson Science
Collins science
Obtaining evidence
While working all safety procedures were followed very carefully like the use of safety goggles and putting the bags under the table. The measurements I feel were fairly accurate as the results were what was expected. There was one anomalous result, however, which was repeated to get a more accurate result. We repeated the experiment three times so we could find averages and get more accurate results. The results were measured to the nearest centimetre cubed because this was the maximum accuracy of the cylinders. The results show the results we got for each experiment.
* Anomalous result repeated above (experiment four)
Analysis and Conclusions
By doing a calculation similar to underneath all the results from the same concentration were added together and divided by three (the number of experiments). The anomalous result was not included in this, however, but the repeated result was.
To find the mean this calculation was used
first result + second result +third result
3
The mean results are
From these results we can conclude that by increasing the concentration of hydrochloric acid the reaction rate is increased. This can be seen as the highest concentration had the highest reaction rate and reached 260 cm3,where as the lowest concentration only reached a maximum of 29 cm3 at the end of the two minutes. The increase does seem to be proportional, as the gradient of the line seems to decrease by roughly the same amount each time. This is shown underneath.
To calculate the gradient the method below was used.
Point on Y-axis
Point on X axis
From this the following Gradients were found
Concentration molars Gradient
2.0= 2.3
1.6= 1.9
1.2= 1.5
0.8= 0.9
0.4= 0.2
The results that were found were what was expected to a certain degree. The reaction rate did not seem to show any signs of slowing down though which is what was expected. This was probably due to the fact that the experiment was not times for long enough though.
The fact that the reaction rate was highest at the highest concentrations shows that the higher the concentration the more particles that are present per set volume which shows increases the rate of reaction. This was not exactly followed in the experiment, which was probably due to a margin of error in the results, but the pattern was still showed. This also proves tat activation energy does not play a part because if this did the gradients of the lines would not increase by the amounts they did. This is due to the fact more/less energy would be needed to start the reaction and there would be a higher or lower gradient of the line so the gradients would not go up /down by the same amounts.
Evaluation
The results that were derived from the experiments showed a pattern but the prediction that was made was not completely supported because the reaction rate did not shown any signs of slowing down. There was one anomaly, however, but this experiment was repeated to give results that matched the pattern. It is not certain why this result was found but it was probably due to the mass of the marble chips being measured slightly inaccurately because we measured the mass of the chips to the nearest whole number this would account for a slight margin of error. Another possibility is because the surface was different for each chip the total surface area was different this would be very unlikely, however.
The measurements were accurate to about cm³ because this how often the cylinders were marked.
The method did show the relationship between the concentration and the rate of reaction but there was a slight margin of error because when turning the cylinder upside down a small volume of water was lost. To solve this problem we could use a gas syringe but the problem with this is we could not test the higher volumes of gas, which would mean the range of results would be lower which would mean the pattern we got would be less obvious.
The experiments were fair tests to a certain extent but there was a certain margin of error because the results recorded were only to the nearest cm³ and the values of the controlled variables were not exact amounts so the may have been slightly differently each time which would have affected slightly the reliability of the results. This would have made little difference to the results though as the volume of gas was only measured to the nearest cm³.
To find if the prediction was supported or to find if the reaction rate did slow down after the time progressed the experiment could be timed for longer than two minutes. This would also enable us to find weather the pattern changed after a certain time or the reaction rate just generally slowed down and we found a curve when comparing the concentration of the acid and the calcium carbonate.
It was also not certain if the concentration keeps increasing the rate of reaction or this only happens to a certain extent. This could be found out by extending the range of concentrations reacted. These reactions would have to conducted very carefully though as hydrochloric acid of this concentration can be very dangerous.