When gases or liquids are heated the particles gain kinetic energy and move faster (see diagrams below). The increased speed increases the chance of collision between reactant molecules and the rate increases. However this is not the main reason for the increased reaction speed.
Variables:
-
Volume of Sodium Thiosulphate (From 50 -> 10cm3)
-
Volume of water (From 0 -> 40cm3)
-
Volume of dilute hydrochloric acid (Always 5cm3)
- Concentration of Sodium Thiosulphate
-
Initial Temperature (Fairly constant)
- Time for precipitation to form
- Rate (1/Time) for precipitation to form
- Light Intensity
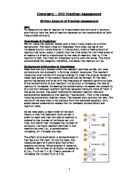
Fair Test:
For a Fair test to occur the variables which are not changing i.e. Volume of hydrochloric acid, initial temperature and light intensity, must remain constant throughout the whole experiment. This means the volume of hydrochloric acid must be kept at 5cm3 and not 4.5cm3 or 5.5cm3. Also no major temperature changed should occur in the room, it should remain constant + or – a few oC. And the light in the room should not change too much either.
Another factor that must be kept the same is when we swirl the flask once which containing the mixture of hydrochloric acid, sodium thiosulphate and water. Every time we start to take a reading the flask must be swirled once, to make it a fair test.
Also the timer must be started at the same point in each experiment. If you take the reading after you swirl the flask once in one reading, then you should not start the clock before of after that in all the other readings.
Apparatus:
Equipment: Conical Flask
Measuring Cylinders
Stop Clock
A4 Paper with Black cross marked on it
Thermometer
Chemicals: Sodium Thiosulphate
Dilute Hydrochloric Acid
Water
Diagram:
Method:
-
Put 50cm3 of 40g/dm3 sodium thiosulphate solution into a flask. Measure out 5cm3 of dilute hydrochloric acid in a small cylinder.
- Add the acid to the flask and start the clock as you do so. Swirl the flask once to mix the solution and place it on a piece of A4 paper marked with a black cross on it.
- Look down at the cross from above. When the cross disappears, stop the clock and note the time.
-
Repeat these steps using different concentrations of sodium thiosulphate solutions. Make up 50cm3 of each solution by mixing different volumes of the original sodium thiosulphate, with water, as shown in the results table.
Safety:
- Wear safety goggles at all times during the experiment.
- Keep lose clothing tucked in and hair tied back if necessary.
- Stand at all times during the experiment.
- Take care when using the chemicals and equipment during the experiment. Especially hydrochloric acid.
Measurements:
-
I will be measuring 5 different concentrations of Sodium Thiosulphate Na2S2O3.
- I will record two readings for the time taken for the precipitation to form. Then I will take the average of the two times taken.
- I will display time against concentration on a graph, then I will display the rate (1/Time) of the average time on another graph.
- By taking an average I am increasing the reliability of my results.
Results:
I will be using the above sort of table to record my results in. The values which are already entered will remain the same all the time, but the others will change. Other variables which are not included in the table like light intensity will remain constant. Also the initial temperature, which is yet to be recorded, will remain constant throughout the experiment.
Results Analysis:
I will also be recording the average time and rate of time for the precipitation to form as said in the method. I will be using the below sort of graphs to record my results.
I expect my 2 graphs to look like this. The average time graph should have a smooth curve and the Rate 1/Time graph should be a straight line.
Calculations:
To work out the rate of reaction you simply divide 1 by the time taken. For example if the time taken is 30 seconds – 1 / 30 = 0.033333333. This value would be difficult to plot on a graph so I then multiply this value by 1*10 3. In other words by 10000. So we represent the rate as in the case of 0.33333333 as 33.3*10 –3. So, Rate of reaction = 33.3*10 –3
To calculate the average time you simply take the first time and then add the second time. With this value you divide by 2. So if the first time is 30 seconds and the second time is 35 | 30 + 35 = 65 / 2 = 32.5 | Average time = 32.5.
Will my results be precise and reliable?
When I take 2 different readings for each different concentration this increases reliability of the results and by taking the average time of my results this is increasing the reliability of them. So the results for the time taken should be valid. But the other factors e.g. light intensity, temperature, the swirling of the flask all must remain constant. If this is all takes place my results should be precise.
If I use more accurate equipment to measure out the different volumes of chemicals I could make my results more accurate. For example to measure out the volume of sodium thiosulphate I will be using a measuring cylinder. This should get me a close enough reading to the volumes I want e.g. 50cm3 or 40cm3. But if I were to use a burette to measure out these volumes I could get a more accurate and precise reading.
(2) Skill Area O : OBTAINING EVIDENCE
Table of Results:
Average times:
22.02 + 23.91 = 45.93 / 2 = 22.965
31.50 + 36.07 = 67.57 / 2 = 33.785
43.78 + 47.53 = 91.31 / 2 = 45.655
52.69 + 49.58 = 102.27 / 2 = 51.135
69.82 + 68.83 = 138.65 / 2 = 69.325
155.88 + 194.73 = 350.61 / 2 = 175.305
Rate 1/Time:
1 / 22.965 = 0.0435 -> 43.5*10-3
1 / 33.785 = 0.0295 -> 29.5*10-3
1 / 45.655 = 0.0219 -> 21.9*10-3
1 / 51.135 = 0.0196 -> 19.6*10-3
1 / 69.325 = 0.0144 -> 14.4*10-3
1 / 350.61 = 0.0028 -> 2.8*10-3
(3) Skill Area I: INTERPRETING AND EVALUATION
Graphs:
See graph paper for 2 graphs.
-
The first graph shows the time taken (secs) for cross to disappear (time for precipitation to form) with the concentration of Sodium Thiosulphate (Na2S2O3).
-
The second shows the Rate 1/Time (secs) for cross to disappear (time for precipitation to form) with the concentration of Sodium Thiosulphate (Na2S2O3).
Conclusions:
After performing the experiment and recording my results in a table, then producing graphs of the results I can now conclude that my prediction is correct. As you increase the concentration of the sodium thiosulphate solution, the faster the rate of reaction is. This means that the precipitate (cross disappearing) will form quicker if there is a higher concentration. Also the same is true for the opposite, as you decrease the concentration of sodium thiosulphate solution, the slower the rate of reaction. In other words the lower the concentration of the sodium thiosulphate the longer it takes for the precipitation (cross to disappear) to form.
My first graph showing the time taken in seconds for cross to disappear (time for precipitation to form) with the concentration of Sodium Thiosulphate (Na2S2O3) produces a smooth curve. The smooth curve is a line of best fit through the plotted points and it shows that when the concentration of sodium thiosulphate is high the average time taken from two readings show that it takes a shorter time for the precipitation to form.
My second graph showing the Rate 1/Time in seconds for cross to disappear (time for precipitation to form) with the concentration of Sodium Thiosulphate (Na2S2O3) produces a straight line. The straight line is the line of best fit which shows that also when you increase the concentration of sodium thiosulphate solution, the Rate 1/Time in seconds increases too. The straight line graph shows the definate trend in which the Rate 1/Time increases. It increases in a steady uniform time from low to high. (The Rate 1/Time is displayed on the graph as Rate*10-3)
As said in the background information, By increasing the concentration of sodium thiosulphate there are more reactant particles per unit volume. This increases the probability of reactant particles colliding with each other and therefore increase the speed of precipitation forming. From my results I have shown that this is true. When we say the concentration affects the time for the precipitation to form we mean that when there is a higher concentration there is physically more of the particles. In this case there would be more thiosulphate ions (S2O32-) to react with the H+ ions, and therefore it takes less time for the precipitation to form, as shown by doing the experiment and drawing the graphs.
Evaluation:
I think that this experiment has gone very well for me. My results were of a particularly accurate standard. This is because I recorded two readings for each concentration and calculated an average from these times. There were no strange results (anomalies) within my results table and I think that this was because of the extreme caution and care that I put into making sure that the experiment was set up correctly with careful measuring of chemicals and substances.
I think that I could have repeated my results more however for the reason that I feel although the experiment was repeated two times, the most accurate results in experiment can only come from constant repeatability which I did not display in my experiment. But unfortunately the time allocated did not allow me to do so and I believe as an improvement of what I could do if I did the experiment again, I would have to say that with more time, I would repeat the results further for even more accurate and reliable results.
I believe that I could have improved the method by making it more specific. I stated clearly all the various methods I took in setting the experiment up but I could have been more specific to how all the apparatus was used and perhaps why I used the apparatus I did as well.
Some other areas in the experiment that I feel I could have improved on were factors like controlling the stopwatch and measuring the amount of sodium thiosulphate and hydrochloric acid. There is lots of room for human error here. However the inaccuracies due to them were negligible because I paid close attention to these during the experiment.
Overall, this investigation has been a very successful one. I feel my results and analysis have been as accurate and reliable as they could have been under the time allocated. However I feel with extra time, I could have repeated the experiment and made it even more accurate and adapted it to try other variables i.e. temperature or adding a catalyst.
To really improve my results I could have changed to recording the time by not just looking down from above at the cross disappearing, but by using computer and data sensors to record the times. This may be more accurate than my own assessment of the cross disappearing. I could also obtain a larger number of readings and possibly use a wider range of concentrations. I could use this method using light sensors to see when the precipitation is formed, and also for temperature, by using temperature sensors.
Liam Brogan. S2F.
This document was downloaded from Coursework.Info - The UK's Coursework Database