Higher temperature increases the energy of the collisions because it makes all the particles move faster. Faster collisions are only caused by increasing the temperature. Reactions only happen if the particles collide with enough energy and at a higher temperature, there will be more particles colliding with enough energy to make the reaction happen. This initial energy is known as the activation energy and is needed to break the initial bonds.
Any reaction can be used to investigate any of these factors that affect the rate and I shall be reacting hydrochloric acid with calcium carbonate to investigate the effect of temperature on the rate of reaction.
Calcium carbonate is seen everywhere. Its lime scale and it is lurking in dishwashers, washing machines and even in kettles! It is a nuisance and people wonder how to get rid of it. One simple way to get rid of this lime scale is to react it with hydrochloric acid. This is difficult as hydrochloric acid is dangerous so the problem of lime scale is hard to overcome. Calcium carbonate reacts with hydrochloric acid:
Calcium carbonate + hydrochloric acid--------> calcium chloride + carbon dioxide
CaCO3 +2HCl------> CaCl2 + H2O+CO2
In my experiment I shall be investigating how the temperature affects the rate of reaction by changing the temperature to see the outcome.
Prediction: I predict that the temperature will affect the rate of reaction. I predict that as the temperature increases, the rate of reaction will increase accordingly. This is because the higher the temperature, the more energy the particles will have. The more energy they have, the more they will be moving around and the more they move around, the higher the chance of collision.
From previous chemistry lessons I know that the rate of reaction is affected by four things; concentration of solution, surface area of reactant, the use of a catalyst and the temperature of the solution. The only variable out of these four that I shall be changing is the temperature of the solution. As the temperature
increases, the chance of collision increases which means that
more collisions will be taking place hence more reactions will take place.
I predict that my graph will look like this…..
As temperature increases, the volume of gas increases
Variables: The variable that I will be changing is the temperature of the hydrochloric acid. I shall heat and cool down the acid accordingly as this is the dependant variable. The variable that I am measuring is how much carbon dioxide gas is given off at certain intervals.
Safety:
- Goggles must be worn as the substance used in the experiment can be harmful to the eye
- Movement around the lab should be quiet and orderly and kept to a minimum so that the experiment can be done with extreme accuracy and concentration
- Hair must be tied back as a Bunsen burner is used and it is dangerous to have hair and loose
- Be careful when handling the acid as it can cause burning
- Be careful when dropping calcium carbonate into acid
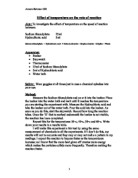
Method:
- Set up experiment by putting the gas syringe in the clamp stand safely.
- Measure using measuring cylinder, 40 cm³ of hydrochloric acid into conical flask.
- Put down a safety mat and place a tripod and Bunsen burner on it. Put gauze on top of the tripod and Bunsen burner.
- Place beaker on top of gauze and put thermometer in it. Switch Bunsen burner on and wait until the liquid has reached the right temperature. When it has, turn the Bunsen burner off. If the temperature is too high, cool it down by running cold water on the sides of the flask.
- Get a spatula of calcium carbonate and measure it using the measuring scales. Take a note of this mass as you must use the same mass throughout the experiment.
- Take the calcium carbonate and drop it in acid. As soon as you drop it start the stopwatch and close the flask with the syringe plug.
- Take readings every 10 seconds of how much gas had been given off by checking the gas syringe.
- Repeat the experiment for all the other temperatures. Cool down temperature by using ice instead of the Bunsen burner. Ensure that you use the same amount of calcium carbonate that you did before by measuring using the scales.
- Record the results for the other temperatures.
Reliability: I am planning to repeat my experiment so that I end up with two sets of results for each temperature as this will make my experiment more accurate and reliable. I plan to test 5 different temperatures as well as testing a few in my preliminary work. I think that 5 is a good range to test.
Preliminary Work: For my preliminary work I tested two temperatures to see what temperatures I should test in my actual experiment. I used 40 cm³ of hydrochloric acid and 1.67 grams of small marble chips. I decided to use temperatures of 50ºC and 13ºC. I also decided to record the temperature every 15 seconds. I used the same method as I decided to use for the main experiment.
I came up with the following results:
During the preliminary experiment I discovered that water at 50ºC was not a good idea as after a minute it was not possible to read the volume of gas given off anymore so I decided to use a lower temperature. Also the gas syringe got stuck at 45 seconds, so it later popped straight to the right temperature, this showed me that I needed to check the gas syringes before use so that I can ensure I don’t get any mistakes like this. I decided to stick with small chips as they were easier when I had to ensure the masses were the same. Furthermore I decided to use 40 cm³ of hydrochloric acid as it seemed perfectly fine in my preliminary. If I took the readings every 15 seconds then I would end up with 6 readings maximum so I decided to take readings every 10 seconds so that I can get up to 9 readings. In addition to this I decided to use a bit more calcium carbonate so I opted to use 2.7grams instead of 1.67 as I figure this will give me more results. I decided to use temperatures with 5ºC intervals so I shall use 15ºC, 20ºC, 25ºC(room temperature), 30ºC and 35ºC
Results: 15˚C 20˚C 25˚C 30˚C 35˚C
I worked out the average times by adding the results from the two experiments and then dividing it by 2. For example I added 7 and 6 to give me 13 then I divided by 2 to give me 6.5.
Gradient: To see how the rate changed over time I needed to work out the gradient and in order to compare the different graphs I needed to plot the points on a graph. I worked out the gradient for each temperature by drawing straight lines from the bottom of the curves and then joining two points on the line to form a triangle. I then took the amount on the vertical axis of the triangle and divided it by the amount on the horizontal axis. So basically I divided y by x: y/x.
15ºC: 2/4=0.5
20ºC: 2/4=0.5
25ºC: 1/3=0.333
30ºC: 3/1=3
35ºC: 4/1=4
Then I plotted the gradients on a graph to see how temperature affects gradient.
Reliability: I repeated each temperature to ensure that my results are reliable. I collected a range of results for temperatures ranging from 15ºC all the way to 35ºC with intervals of 5ºC for each. I have results for 12,20,25,30 and 35ºC.
Conclusion: Looking at my results I can notice a trend. As temperature increases, the rate of reaction increases. In my prediction I stated that as the temperature increased the rate of reaction would increase. As the temperature increases, more and more gas is given off. This is because the higher the temperature, the more energy the particles will have. The more energy they have, the more they shall be moving around. If they move around more they will have more of a chance of collision because of collision theory. The higher the collision rate the more reactions will take place. Therefore the higher the temperature the higher the rate of reaction. I proved my prediction to some extent because some higher temperatures were not successful in the experiment and was slower than lower temperatures. The readings for 25ºC did not match my prediction. There are many reasons for these incorrect results and I shall explain them in my evaluation. If I exclude these from my conclusion I can conclude that an increase in temperature means an increase in the reaction rate.
Evaluation: I think that my experiment went fairly well. My results fit the pattern pretty well. As well as this, the experiment was repeated for extra assurance. Looking at my table I can see that the repeats are similar. For 15ºC the range between the repeats is 8 which instantly reveal that my results are very accurate. However when I look at my results for 20ºC I can see that my range is much larger and is 35 which tells me that these results are less reliable. When I glance over to my 25ºC readings, despite one set of results being anomalous the range is still only 18. Looking up at my higher temperatures I have fewer readings as the reactions were quicker. The readings for 30ºC give me a range of 15 and the readings for 35ºC give me a range of 10. All of the ranges are under 20 with the exception of the 20ºC results which gave me quite a large range and I shall be explaining why I may have got this result later. If I look at my graph I can see that almost all the points are close to, if not touching the curves of best fits. There are three points which are quite far from the curves and are circled on my graph since they are anomalous. The reliability of my experiment depended on whether my experiment was a fair test. I think that my method was very fair as it was followed carefully to ensure that a good experiment was conducted and a good conclusion would thus be made. To make my experiment more reliable I would need to use a wider range of temperatures. I would need to test more values and use smaller intervals between the values.
I think that my experiment was very accurate. The time was to two significant figures and was measured to the nearest second. The volume of gas was between one and three significant figures and was measured to the nearest centimeter cubed. The temperature was to two significant figures and was to the nearest degree centigrade. The divisions on the thermometer were one degree apart whilst the divisions on the gas syringe were of 1 cm cubed. The measuring cylinders had divisions of 1 cm cubed and the conical flask had divisions of 50 cm cubed. The equipment used to measure was very accurate and was the same for the entire class. I could improve my experiment by using much more accurate equipment. I could use a pipette to ensure that my measurements for the acid were even more accurate. I could also use