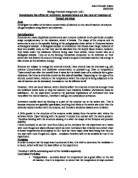
Prediction
This diagram is very simple (diagram from www.gcsescience.com but it shows that an enzyme is most active around 40°C and the activity decreases when it is both hotter and colder than 40°C. I came to this theory from my background knowledge I know that Amylase functions best at 37oC, which is body temperature. If the temperature is above or below 37oC these enzymes function slower, and therefore take more time to break down these food molecules. I believe that this theory will be proven in my experiment. I believe as the temperature is increased the rate of reaction will slowly but noticeably get quicker, however once a certain temperature is reached. This certain temperature I believe is body temperature of 37 °C. Once the temperature is past this, I predict that the rate of reaction will dramatically drop. I predict this because in other chemical reactions when the temperature increases the reaction happens faster since at higher temperatures the molecules in chemicals move around faster thus making them react I believe this to be different for the enzyme amylase since at higher temperatures or near to 60°C the enzyme is completely denatured and ceases to work.
Method
The solutions of starch and amylase are ready made up for easy access. The amylase is carefully poured slowly into a plastic graded test. The level is then checked by placing the graded tube on a flat surface and reading the level at eye level. The starch is then measured in the same way in a different graded test tube. The temperature of the amylase is raised or lowered to the temperature needed using the smallest thermometer with the most precise measurements. Then the two substances are poured into one test tube and shaken 3 times. Then a pipette is used to extract 3 drops. The 3 drops are then placed into a Spot tile that already has 3 drops of Iodine placed in each tile the solution of starch and amylase is then dropped every 20secs or as closest to 20secs as possible. If the iodine should change black in the final solution, it means no reaction has taken place, but should it turn orange, a reaction has taken place. The results are then recorded in the table and the same steps are repeated, however to change the temperature of the amylase for the experiment, the test tube will be heated until desired temperature is reached. For the best results my experiment will be repeated 3 times to ensure that I get the most accrete results possible.
Equipment List
Kettle, Water, Starch, Amylase, Iodine, 2 Large Beakers, 2 Test Tubes, Thermometer, Spot tile, Pipette, Test Tube Rack, Stop Watch and a graded test tube.
Risk Assessment
Using hot water could cause a risk of burns.
Variable Table
Method Diagram
Trial Data
This trial data was done on a focus science computer program.
From the trial data it is clear to see the only variables that have an effect on the experiment are time and temperature.
Obtaining Evidence
Introduction
These are my results I found out when I did my experiment. I repeated the experiment 3 times to ensure the best accuracy.
Experiment 1
Experiment 2
Experiment 3
Mean Averages
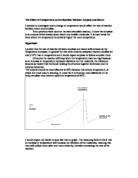
Analysis
Experiment 1
In this graph of experiment 1, the reaction time has a minimum value of 1:30 this happens at 35°C. The highest value occurs at 25°C and this is 5:00. From 25°C to the minimum value of 35°C the reaction time decreases at a decreasing rate. From the minimum value 35°C to the last value of 55°C the reaction time increases at a decreasing rate.
Experiment 2
In this graph of experiment 2, the reaction time has a minimum value of 1:20 this happens at 35°C. The highest value occurs at 55°C and this is 3:20. From 25°C to the minimum value of 35°C the reaction time decreases at a decreasing rate. From the minimum value 35°C to the last value of 55°C the reaction time increases at a decreasing rate.
Experiment 3
In this graph of experiment 3, the reaction time has a minimum value of 1:00 this happens at 35°C. The highest value occurs at 60°C and this is 5:20. From 25°C to the minimum value of 35°C the reaction time decreases at an increasing rate. From the minimum value 35°C to the last value of 60°C the reaction time increases at a decreasing rate.
Mean Averages
In this graph of the mean averages, the reaction time has a minimum value of 1:20 this happens at 35°C. The highest value occurs at 55°C and this is 3:20. From 25°C to the minimum value of 35°C the reaction time decreases at an increasing rate. From the minimum value 35°C to the last value of 55°C the reaction time increases at a decreasing rate.
Conclusion
From my graph of averages, I can see that when the results are put into a mean average form the Y axis in this case, the reaction time has a minimum and a maximum value. The maximum occurs at 55°C and is 4 minutes and the minimum value occurs at 35°C and is 1.26minutes which happens to be the closest value to 37°C, which is the temperature I predicted the enzyme amylase would function best in. From all my results I can tell that enzyme activity was slower below the optimum temperature of 37°C but lower than 37°C was better than the enzyme being above 37°C, due to the enzymes changing of shape at extreme temperatures. All my results match my prediction. The rate of reaction dramatically dropped above and below 37°C in most instances above 37°C was slower than below 37°C. However this wasn’t the case for experiment 1 possible reasons for this could have been the concentration of my amylase solution or possible the concentration of my starch solution.
Reliability of Results
From the results I can tell they were reliable because they follow my predicted trend and I only had one anomalous result which I did not use to calculate the 60°C average, as the anomalous result was the only result I got for 60°C in experiment 3. One possible reason for this result could have been that the solution of amylase was different to the other experiments or the starch solution was different to the other experiments. Also experiment 3 doesn’t follow the trend that 25°C to the minimum value of 35°C the reaction time decreases at a decreasing rate. From the minimum value 35°C to the last value of 55°C the reaction time increases at a decreasing rate it has this trend, from 25°C to the minimum value of 35°C the reaction time decreases at an increasing rate. From the minimum value 35°C to the last value of 60°C the reaction time increases at a decreasing rate. The reason for this is the same as why I got a result for 60°C the fact that the concentration of the amylase and starch could have been different from the ones used in my other experiments.
Evaluation
Accuracy of results.
Measuring Of Time
One difficult thing about taking the readings at a certain time was allowing enough time to follow the planned procedure and drop 3 drops in at a specific time. I had to allow my self time to drop the solution into the iodine so I could get as close to my target time as possible. Also the stop watch measures to one hundredth of a second. This could have been better by using another more accurate stopwatch but for our investigation it wasn’t too big a factor. However with the equipment we had to measure time, the best results were found.
Measuring of Solution
The method to test the solution for traces of glucose was preformed accurately and the iodine preformed its job perfectly on all occasions. Each time it did this it was a fair test - there was little to no variation in the amount of Iodine in each section of the spot tile.
Reliability
There was only one significant problem found in the test was that the concentration of amylase was never suitable to fit our plan so we had to change the plan and test for a reaction over a shorter amount of time. However this aside the accuracy and reliability of the results and conclusions are very good.
Improvements
The procedure used was simple and straightforward, however only one difficulty was encountered as mentioned before. This was the concentration of the amylase. A small improvement could have been made by testing the concentration of the amylase at the start before starting our experiment. Alternatively, our own concentrations of amylase could have been made up, as to ensure that the amylase was always the same concentration.
We could of also have taken results at different temperatures to increase our range of results this would of helped dramatically to able us to a see a trend more clearly.
More repeats could be taken but I don't think this would add much to the accuracy of the conclusions. More accurate equipment could have been used but again but I don't think this would add much to the accuracy of the conclusions.
Extending the investigation
Suggestions have already been made to extend the investigation to improve our knowledge of enzyme activity. After having previously found out about how temperature affects one particular enzyme, we could test other enzymes but according to my background knowledge most enzymes function at body temperature anyway. We could also test to see what the effects of PH have on enzyme activity and test to find out the optimum PH. Then we would have a full set of results to show the overall best conditions for enzyme activity.