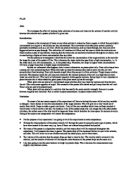
Method
First I produced the potato cylinders, using a corer, and cut them to 40mm size using a ruler and scalpel, on a tile. During my pilot study I observed the apparatus I would use, and I chose a potato corer size 5 to cut out the cylinders, because the vessel I had chosen to hold the solution was a 5 ml test tube, and I felt that the size 5 potato cylinder, fitted well into the test tube, as it allowed it to be fully immersed, with plenty of space. Then I created the mixtures my mixing together parts of distilled water, and the two sucrose solution. I was very careful; as I decided to use syringes to get an accurate measured result. In addition, I used two different syringes for the 2m and 0m solutions to avoid contamination. Next I began placing the solutions in test tubes, and placing the cylinders in. at this point I decided that it would not be fair if I did not blot the potatoes first, as then there was excess moisture, so on some spare cylinders I rolled potatoes once, twice, on both sides, etc. and finally decided the best and most efficient way of blotting the potato was rolling it forward for five seconds on a piece of tissue. I then did this to all of the cylinders I was to use in my pilot study. Then I weighed them, and recorded the results. I decided to calculate percentage change in mass, as all of the potato cylinders started off at different masses, to produce a standardised result. Next I chose the amount of time to leave the cylinders in the solution; I picked 15 mins, as I felt it was sufficient. So using my stop watch I timed this, and very carefully, I marked all of the test tubes I was using with a china graph pencil, as this way I would not get confused. So after the 15 mins were up, I blotted the potatoes again the same way, and weighed them. I then recorded my results:
Pilot Study Results- Time 15 minutes
Even though my results did follow my hypothesis, I was slightly disappointed that the difference between the potato before and after was small- so I decided to extend this time by ten minutes in my main experiment- as I feel it would be enough time for sufficient osmosis to occur. After looking at my results, I found the concentration at which there was little difference was at 1 M, so in my main experiment I have decided that I will use a range of 5 concentrations to get a better result. I also decided that I would use tweezers to blot the tissue with, as there was a significant amount of moisture on my hands, which may have influenced the results.
The Actual Experiment
Aim: To investigate the effect of varying concentration of sucrose in a solution on a potato cylinder of a given size
Apparatus:
- Tile (to cut potato on)
- Scalpel
- Tweezers
- Syringe
- Potato
- Corer (size 5)
- Ruler
- Test tubes
- Distilled water
- 2M sucrose solution
- Mass scales
- Tissue (to blot)
- China graph pencil (to mark)
- Stop watch
Method:
Prepare the 40mm potato cylinders with corer, ruler and scalpel, prepare the solutions (using syringe), blot (using tissue paper) the cylinders (roll for 5 seconds forward), weigh them, and record results. Using stopwatch, put respective cylinders in respective solutions (using china graph pencil to make sure we don't got confused, and time 25 minutes. After blot the cylinders, and weigh. Record results. Repeat method again for second set of results.
Variables I am going to control
To create a fair test certain aspects of the experiment will have to be kept the same whilst one key variable is changed. The key variable in this experiment is the concentration of the sucrose solution. If any of the non-variables below are not kept constant then it may influence my results, which would make this experiment an unfair test. For example if one of the potato cylinders was 50mm instead of 40mm, this could greatly influence my results, as then there is an extra 10mm of surface area for osmosis to occur. Below are the aspects I am going to control, as they could influence the experiment and make it an unfair test:
- Temperature: by doing all tests in one room at a constant room temperature, as eat may cause a change in the kinetic energy of the molecules, thus speeding up the process of osmosis, and altering the amount of water molecules which may pass through the membrane, thus altering the mass of the potato cylinder.
- Time: I carefully used a stopwatch to monitor the same time intervals throughout the experiment, as more time, allows further osmosis to occur, and affect the mass of the potato cylinder.
- Size and length of potato: by using a corer, ruler and scalpel accurately, because unlike sized cells are not subject to the similar rates of osmosis, therefore causing our results to be highly erratic, as more/less water molecules greatly affects the amount that will pass through the potato’s partially permeable membrane, and affect the mass of the potato.
- Excess moisture on cylinders: by blotting them in the exact same way each time, because without blotting there are excess water molecules outside of the potato cells, meaning they will affect the amount that will pass through the potato’s partially permeable membrane, and affect the mass of the potato.
- Control water content in potato: by using one potato in each test, because different potatoes may absorb at different rates.
- Same set of scales: am also going to use the same set of scales, as measurements may vary slightly between scales, affecting the accuracy of our results.
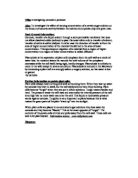
Range:
I chose a range of five different solutions. This is a diagram of the ratios and proportions I used to create my solutions:
Safety Aspects:
The main safety aspect in this experiment was the handling of the scalpel, so it was necessary to hold the knife by the handle facing downwards at all times, and to use breakable apparatus such as the test tubes gently and with care. Also to make sure all breakable objects are as far back from the table corners as possible, avoiding breakage or accidents.
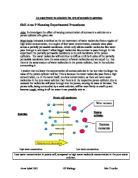
Skill Area O Obtaining Evidence
When obtaining my measurements and results, I tried to work very carefully and accurately. In my results table I decided to use maximum three decimal places as I felt it was sufficient.
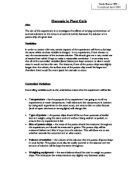
Skill Area A Analysing Evidence and Drawing Conclusions
Although the results are quite varied, it is clear that the peak on each of the graphs is when the concentration is at 0m, and the lowest point on the graph is at 2m. My results support my prediction, in the sense that the peak is always at 0m, and I see a clear negative correlation.
I conclude that a potato cylinder in a concentrated solution will decrease in mass, whereas a cylinder in a dilute solution will increase in mass due to osmosis.
Skill Area E Evaluating Evidence
The experiment was successful in my opinion, as I gained good results which allowed me to plot an informative graph, and my results did follow a pattern, proving my prediction correct, and the time that I used for the experiment to last was enough to allow sufficient osmosis to occur. However, if I was to repeat the experiment I might well increase the time of the result to allow more osmosis to happen. The range of concentrations was adequate but I would possibly create more concentrations if I repeated the experiment so that I would have more varied results, i.e. 0.10m, 1.15m, 1.20m, and so on. The cutting of the potatoes was the most difficult part of the experiment as although I was recording my results by mass, it could well have affected the surface area and so the overall rate of osmosis. If I were to repeat the experiment, I would have possibly found a machine to cut the potato as it would ensure that all potatoes would be the same weight and dimensions.
As well as the potato, I could have found a more accurate way to measure out the solutions and to determine the molar concentrations. I could also weigh each cylinder on a more accurate scale, e.g. not to 0.00g but to 0.0000g.
There were not any out of the ordinary results, but some were not as close to the line as others i.e. (2, -11.32), contamination or inaccuracies may have caused this. Also I felt that there must be another method of blotting, as I feel that I may have dried some more thoroughly than others, also next time I would have wiped the scales and my hands each time I came in contact with the cylinders, and perhaps this would have solved the anomalies on my graph. If the experiment was repeated, I could find another way to dry the potatoes that would ensure that all were dried in the same way for the same time. Also I had to use 3 different potatoes on different days, which may have affected the results as each potato has a different water concentration, perhaps I could conduct all the experiments using the same potato, or maybe be use a mention that measured water concentration- this would make my results far more accurate. However with all this said I think that the experiment was successful and I was pleased with the complete comparison of my results with my initial prediction. For further experiments I could measure how the varying concentrations of a sucrose solution affects the rate of osmosis on different vegetables; and see whether they reflect the results I obtained in this experiment.