3. After placing the different 10ml concentrations into 5 different test tubes and labelling each test tube with the concentration, I will then place 3 potato cubes in each test tube. By using 3 potato cubes for every concentration I will be able create an average which will give me a better set of results and more accurate graphs with less anomalous results.
4. After waiting for 2 hours and 30 minutes I will drain out the solutions into the sink and place all the cubes onto the paper towel in the order which I had put them into the test tubes as to show which potato cubes came from which solution. Each potato cube will be dried with a paper towel, to rid them of any excess solution and will then be placed onto the electronic scales so their mass can be recorded accurately. As well as measuring the change in mass using the electronic scales I will also check for a change in dimensions by using the vernier calliper to measure the each potato cube.
Fair Test:
Fair testing should play a big part in this experiment. If this experiment isn’t a fair test, the wrong results would be obtained which could lead us to the wrong conclusions. To create a fair test certain aspects of the experiment will have to be kept the same whilst one key variable is changed. I have chosen to vary the concentration of the sugar solution. This will give me a varied and reliable set of results from which I hope to make a correct conclusion. If any of the non-variables below are not kept constant this could cause the experiment to be an unfair test:
- First of all, and most importantly, I will have to get the measurements of the solutions and the potatoes as exact, and as accurate as possible. I will try and get the measurements of the potatoes as accurate as possible for every single cube by evenly cutting the potato pieces, and making a record of the dimensions to the nearest millimetre using a vernier calliper. As well as this I will also be using a set of electronic scales which are very sensitive so that I can get the best readings possible. For gaining an accurate measurement of the solution I will read at the bottom of the meniscus.
- When using the electronic scales, I will make sure that the electronic reading is reset before I place the potato cube on it. This is so that I don´t get a false reading with the weight of the cube as it would still contain the weight of the cube from before. Also the reading of the mass should be taken to 2 decimal places as this is a fairly accurate measure of the mass.
- Before measuring the mass and dimensions of the cubes they should be dried with a paper towel so that any excess water, which could affect the mass, can be removed. However, squeezing the potato cube too hard while drying it could cause the cube to be compressed which would affect the dimensions and so care should be taken when drying the potato cube to not squeeze too hard.
- I will perform the experiment at room temperature as a varied temperature could affect movement of molecules in osmosis. Carrying out the experiment at a constant temperature for the 2 hours and 30 minutes of the experiment is important. To avoid temperature change, which might affect the different sets of results, we will take the temperature of the solution into account.
- One of the most important steps in the experiment is to make sure that the potato cube is fully covered by the solution. The cube should be fully submerged and should have total contact with the solution as if this does not happen the full effect of osmosis might not occur.
- Finally, small things such as a dirty test tube, and a slightly cracked measuring cylinder could still affect the results, and therefore I will take these into account as well.
Safety:
Safety is an important aspect in any experiment, even if this particular experiment seems to be very harmless. I will be using a very sharp knife, which could injure someone if it is not handled properly and so care should be taken when handling it. I will also be careful that the solutions don´t get into our bodies internally, just in case, because we are not fully aware of the damage it could do to us. However, other than that, there aren’t any major matters to be cautious of.
Prediction:
Osmosis is defined as the net movement of water or any other solution’s molecules from a region in which they are highly concentrated to a region in which they are less concentrated. This movement must take place across a partially permeable membrane such as a cell wall, which allows smaller molecules such as water through but does not allow bigger molecules to pass through. The molecules will continue to diffuse until the area in which the molecules are found reaches a state of equilibrium
(i.e. isotonic), meaning that the molecules are randomly distributed throughout an object, with no area having a higher or lower concentration of sugar than the other.
For this particular investigation I think that the lower the concentration of the sugar solution in the test tube the larger the mass of the potato will be. This is because the water molecules pass from a high concentration of water to a low concentration of water such as in the potato cube. Therefore, the cubes in higher water concentrations will have a larger mass than cubes in low water concentrations as the cells in high water concentrations become turgid when water moves from the high water concentration into a lower water concentration which in this case is the potato cube.
In the low sugar solutions (i.e. 0, 0.1, 0.2 moles) I believe that the water will be more concentrated in the solution than in the potato, and therefore the molecules should move from the water to the potato, making the potato bigger in dimensions and heavier in weight. The potato cubes, being surrounded by a weak sugar solution, will be most likely to swell up and become turgid, taking in all the water it can possibly take in to become isotonic.
With the potato cube in higher concentrations of sucrose (i.e. 0.4, 0.5) I think that the weight of the potato will decrease dramatically due to the movement of water molecules. As there would be a low concentration of water outside of the potato, any water inside of the potato would move through the partially-permeable membrane and into the high concentration of sucrose due to the fact that water molecules always
move to lower water concentrations, which are in this case, the sucrose solution. In doing this it will become plasmolysed.
So in conclusion, I believe that when the water concentration is lower in the potato, the water will move through the partially-permeable membrane of the potato, and the potato will gain weight becoming turgid. If there is very little difference in the two water concentrations (of the potato and solution) there shouldn’t be such a big change in weight or dimensions of the potato cube. If there is a higher concentration of water in the potato, the water will move out of the potato and the potato cells will become plasmolysed.
Preliminary Results:
In this preliminary experiment I used concentrations that covered a large range, from 0 to 1 mole:
As well as this, the mass of each potato piece weighed 3.5 grams and the dimensions measured 2cm x 1cm x 1cm before the experiment. There was one piece of potato in each of the test tubes which allowed me to gain the following results:
Possible Improvements:
While I was able to gain a set of results from this preliminary experiment, there are a number of faults found which could be improved upon in the final experiment. The first being the accuracy of results, while I have one result for each sugar concentration, this result could be anomalous and I would not know if it was or not. In order to solve this problem I will use 3 potato cubes per test tube instead of 1, this will then give me three sets of results per test tube from which I will be able to calculate an average for each concentration which will have less chance of being anomalous. Another factor which could improve the reliability of the results would be the weight and dimensions of the cube. In this preliminary experiment I used dimensions of 2cm x 1cm x 1cm for to potato piece. However, if I were to change the dimensions to 1cm x 1cm x 1cm there would be a cube shaped potato piece that would have an equal amount of osmosis activity in all areas as the length of each the side would be equal which would also decrease the weight of the potato cube.
Results:
(Note: results highlighted in BOLD are anomalous and have been excluded from the percentage averages below.)
Final Mass – Initial Mass
Original Mass
Percentage Change Averages:
In the table above, the percentage shows a steady decrease, telling us that the percentage of the difference decreases as the water concentration decreases. This experiment helped me find out that osmosis occurs between 2 liquid substances with a partially permeable membrane, and that the higher the water concentration of the solution is, the larger the increase in weight of the potato. This means that the percentage will also be higher, increasing with the grams.
Analysis:
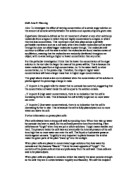
This graph shown above gives the line of best fit for the percentage change in mass of the potato chips over the course of the 2 hour and thirty minute experiment. The graph is a straight line that slopes downwards and does not go through the origin. The line is straight and this therefore means that the percentage gain and loss in mass and concentration are directly proportional. As well as this there is a pattern on my graph which shows that as the concentration of the solution increases, the percentage change in mass decreases. The graph shows that the percentage gain and loss are inversely proportional to the concentration. The gradient does change in my graph. It gets less steep as X axis gets bigger. This is because the potato chip is becoming as flaccid as it possibly can, and so the change in mass of each molar concentration is becoming closer and closer together. From the line of best fit that has been added in, it can be seen that all of my points were very close to creating a perfectly smooth curve. This shows that my results are fairly reliable. My graph fits in with my prediction of the experiment graph.
It shows that the potato cubes increase in mass when in solutions with a high water concentration and decrease in mass when in solutions with a low water concentration. When the concentration reaches above 0.4 M, there appears to be a slowdown in the amount of water loss, suggesting that the cell is fully plasmolysed and does not have any more water to lose.
From the graph an estimate to the sucrose concentration of the potato cell can be made as 0.17 M on the X-axis, as this matches up against the 0% point along the Y-axis where the potato cube is not increasing or decreasing in mass, this is known as the isotonic point or osmotic equilibrium (i.e. where no osmosis is taking place and both the potato and the solution have an identical molar concentration). The next point, 0.2 M looses approximately 4.0 %. This shows that the water potential of the sugar
solution in the beaker is weaker than that of the potato chip. The next, 0.5 M, looses approximately 8.0 % in mass. This shows that the salt solution has an even weaker water potential than 0.2 M and that osmosis took place. This is why the potato lost even more mass, and it shows that the water potential in the beaker is less than that of the potato chip. This pattern carries on through the graph, and even more mass is lost, as more water moves out of the potato into the solution. My results also match with my initial predictions.
The prediction made is supported by the evidence obtained from this investigation. It shows that the potato cells increase mass in solutions with a high water concentration and decrease in mass in solutions with a low water concentration. At concentrations above 0.5 M, it appears that there will be no further water loss, suggesting that the cell is fully plasmolysed and cannot lose any more water.
From the graph an estimate to the concentration of the potato cell can be made as
0.17 M. As it is at this point where the potato is not increasing or decreasing in mass. However, it is important to realize that this is only an estimate as the potato cells will not be uniform in their concentration.
Evaluation:
By following my method correctly I was able to gain accurate results which gave sufficient evidence that proved my prediction. My final results were fairly reliable, due to the precautions I took to make this a fair test.
Changing factors such as the dimensions of the potato cube and the quantity of the solution were changes that greatly improved the outcome of the final experiment. These changes were easy to make, because I performed a preliminary experiment, which allowed me to iron out any errors that could have occurred in my actual experiment.
I believe that I recorded a sufficient amount of results for the concentrations that I was given, and the time restrictions that I had to follow (1h 30 minutes).
There were a few anomalous results as some results were not as close to the line of best fit on the graph as others. This may have been caused by human error, or one of my results could have been inaccurate and therefore affected the overall average for that concentration. Another cause could have been the fact that the potato cube was not cut accurately, or that certain potato cells lost or gained mass better than other depending on the variety of the potato. The fact that a certain part of the potato may not be the same as another was shown when cubes of the same length were not the same weight as each other. This is another reason to use cloned or similar variety potatoes. My results were consistent; however certain results were anomalous; such as the first potato cube used in the 0.4 Mole concentrations which was not included in the final average for 0.4 Mole. When the graph was drawn, other anomalous results also became clear, both the 0 and 0.1 Mole concentrations were not exactly on the line of best fit which leads me to believe that these particular results were anomalous. This may have been caused by human error.
The experiment was very successful in my opinion. I obtained a large quantity of very accurate results from which I was able to create informative graphs. I think I took enough results for the number of concentrations I was using, and the time I waited for the experiment last was enough to allow sufficient osmosis to occur.
The graph obtained in the results has a strong resemblance to the one in the prediction. This suggests that the experiment was fairly accurate.
Overall this experiment was a success as I obtained a set of results and a graph that show that:
1) Osmosis actually took place in the experiment.
2) As the concentration of mole increased, the percentage of the weight difference decreased.
My results did lie close to the curve, and were therefore fairly accurate, but if I was doing the experiment again I could make changes, some as mentioned below.
Improvements:
- The experiment could have been performed with more people as it would have then been much more organized and certain tasks could have been performed by more than one person, therefore reducing the chance of mistakes.
- Using more concentration of sucrose solutions would have helped me obtain better results, and more accurate results; so that we can make sure the results are totally correct. As well as to fill in the gaps in my graph, I could have taken results of more moralities, i.e. 0.10m, 1.15m, 1.20m, etc. This way I could have found a more accurate isotonic point by there being no change in mass. This would show the water potential of the potato, and this result could then be used further.
- Experimenting with one concentration for a longer period of time which would lead me to better results, because the osmosis action would reach its maximum capability, and therefore tell me how much water could be transferred for each solution.
- Also to improve my experiment I could have repeated it more.
- I could have also used cloned or similar types of potatoes, so that they would all have the same properties.
- I could have also cut the potatoes into doughnut shapes, because the cells in the centre of the potato may have a different capacity of water and the intake, or distribution of it, or different water potentials. If I had cut the potato into doughnuts, I would have only been using the out side of the potato, leaving out the middle. I could have also used a machine to cut the potato chips more accurately (to the micro-meter).
- I could also use a burette measure out my solutions. This would ensure that I have an accurate amount of fluid in each test tube. As well as the potato I could have found a more accurate way to measure out the solutions and to determine the molar concentrations. Perhaps I could have used a burette. This would ensure that I have an accurate amount of fluid in each test tube.
- I could also weigh each chip on a digital and more accurate scale, e.g. not to 0.00 but to 0.0000g.
- The cutting of the potatoes was the most difficult part of the experiment as although I was recording my results by mass, it could well have affected the surface area and so the overall rate of osmosis. If I were to repeat the experiment I would have possibly found a machine to cut the potato as it would ensure that all potatoes would be the same weight and dimensions.
- Although 3 repetitions of each concentration are sufficient, there was a possible anomalous result (circled on graph). This part of the investigation would need to be repeated.
- When the potato chips were removed from the test tubes and dried I may well have dried some potatoes more thoroughly than others and so some would have more excess water, which would add to the mass. If the experiment was repeated I could find another way to dry the potatoes that would ensure that all were dried in the same way for the same time.
Extension of the Experiment:
I could extend my investigation by testing the percentage change in mass with morality using a different substance. By this I mean using a different vegetable, perhaps celery or cucumber. Then I could find out whether osmosis occurs with the same patterns and trends with any vegetable (e.g. carrots).
Further work could be carried out to include concentrations that increased in 0.05 M rather than 0.1 and to cover a larger range of concentrations. This would increase the accuracy and reliability of my results and improve the graph.