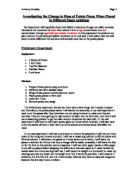
Equipment:
6 test tubes
A set of scales
6 pieces of potato
0%, 5%, 10%, 15%, 20%, 25% concentrations of sugar solutions
Test tube rack
Sticky labels
Measuring cylinder
Method: We carefully weighed each of the 6 pieces of potato and recorded the weight in grams. Each of the potato pieces were placed into individual test tubes. To the first test tube we added a measured amount of 0% concentration of sugar solution (water) making sure that the potato was covered. This was repeated using each of the different concentrations. The measuring cylinder was rinsed between each concentration to avoid contamination and ensure a fair test. The test tubes were then labelled to show the concentration used for each piece of potato. The experiment was left for 48 hours to allow osmosis to take place.
After 48 hours we carefully drained each piece of potato making sure that we removed any excess water. The potato pieces were weighed again individually and the results were recorded.
For each set of results the differences were calculated to show the change in potato mass. This difference was then changed into a percentage and shown as a positive or a negative depending on whether the potato had gained or lost weight.
The whole experiment was repeated and the results were recorded separately (set A and set B).
Results:
Set A
Set B
Both sets of results were plotted onto a graph and the lines of best fit drawn in.
Conclusion:
Both sets of results support my predictions and when left in the weaker solutions, the potato pieces took in water by the process of osmosis. As the concentrations of the prepared solutions increased, the potato pieces began to lose water. This shows that in both experiments osmosis did take place.
The lines of best fit for both sets of results show that there is a point where the potato pieces stop taking in water molecules and equilibrium is reached. This point is when the concentration of the prepared solution is the same as the concentration in the potato pieces and osmosis cannot take place. Osmosis only happens when there is a weaker solution and a stronger solution.
Although the trend for both sets of results is the same, the points at which equilibrium is reached are different.
For set A, this point would be about 1.5% concentration of sugar solution. For set B the point at which osmosis stops would be 5.1% This could mean that the two sets of results show that the concentration of solution in the potato pieces were different to begin with. The potato pieces used in set A took in less water to begin with, reached equilibrium earlier and began losing water sooner.
In set B, the potato pieces gained more weight to begin with, reached equilibrium later and began losing water later.
This could be because in set A and set B potato pieces from a different potato were used. To begin with, the potato in set A could have already contained more water and so would have needed a weaker prepared solution to reach equilibrium.
Other factors remained constant. The temperature in the room and the prepared solutions were the same for both experiments and so should not have affected the results.
If I were to repeat these experiments again, I would make sure that I used potato pieces that all came from the same potato. This would make it more likely that the concentrations of solutions in all of the potato pieces were the same to begin with. This should make both sets of results closer and the point at which equilibrium is reached similar.
I would also continue the experiment further to see at what concentration of prepared solution the potato pieces actually stopped losing water. The results for set B show that weight loss had dramatically slowed down for the 25% prepared sugar solution. Set A shows that even by 25% prepared sugar solution the potato was still losing quite a lot of water and osmosis was still going on.
Finally, I feel that this experiment was successful and that the results back up my predictions. There were no real anomolies in either set of results and the process of osmosis worked as I had expected.