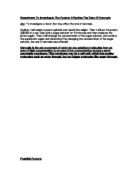
Prediction
I predict in my experiment that the higher the concentration of sugar in the solution, the smaller the potato chip will become. I predict this as the greater the concentration of water in the external solution, the greater the amount of water that enters the cell by osmosis. The smaller the concentration of water in the external solution the greater the amount of water that leaves the cell. The potato will become smaller showing the effects of osmosis. Likewise if there were a lower concentration of sucrose I would expect this to reverse and the potato chip would become larger. Sometimes there also may be no change in mass as the solution inside the cells is equal to that concentration of the solution outside; therefore there would be no need for osmosis to occur. From my results prediction I can see my results graph should look something like the sketch on the enclosed graph paper.
Equipment
- 6 Test tubes, to put the potato chips and sucrose solution in. I have chosen to use test tubes, as they are the correct size to completely submerse the potato in solution without using an excessive amount.
- 6 bungs, to cover the test tubes.
- Test tube rack, to hold the test tubes upright preventing spillage and maintaining the position of the potato cylinders ensuring coverage by the solution.
- Pins, to support chips on underside of bung.
- Cork borer no.6, to cut uniform diameter chips.
- Sucrose solution, to make a range of concentrations (shown below).
-
Scalpel, to adjust any potato to correct length.
- Tile, to cut potato chips on safely.
- Distilled Water, to make up different concentrations of sucrose solution.
- Electrical digital balance, for weighing potato chips to 2.d.p for obtaining accurate results.
- Potatoes, to be used as testable plant material.
- Potato peeler, to peel potatoes before investigation.
Method
- Collect all equipment.
- Peel potatoes to remove the skin, which is a different tissue. Cut up 12 pieces of potato using no.6 cork borer. 2 for each test tube as it will be more accurate than 1 and give a more accurate result, as I will be able to then work out an average.
- Find the mass of the potato pieces in grams correct to 2.d.p using electronic balance. If necessary cut a small piece off potato to make all pieces of an even mass.
- Measure solutions into test tubes as follows;
- 20cm distilled water, 0cm sucrose solution
- 18cm distilled water, 2cm sucrose solution
- 16cm distilled water, 4cm sucrose solution
- 14cm distilled water, 6cm sucrose solution
- 12cm distilled water, 8cm sucrose solution
- 10cm distilled water 10cm sucrose solution
Put solutions into test tubes and place in test tube rack.
- Place 1 pin with 2 pieces of potato into the test tubes and place bung in.
- Leave at room temperature out of direct sunlight for 24 hours.
- After 24 hours I will take my results by re-measuring each potato mass and recording it.
Results and Analysis
The table below shows my raw data. The last column was worked using the formula;
Mass after-mass before = change in mass
I can see here the first mass readings don't seem to change much. Or have any regular pattern. There could be a number of reasons why this has occurred, including mass values not being recorded correctly or these potato samples may have not been completely submerged in the solution.
The second readings seem to have a clearer pattern. The mass seems to decrease as the sucrose solution increases though there seems one anomalous result for 0.6 moles, which could have been caused by a mistake in measuring potato or sucrose solution.
I have now worked out the percentage change for each reading using;
Average % change = change in mass x 100
Starting mass
And the average by calculating;
Reading1 + reading 2 = Average
2.
The table shows that all the average percentage changes are positive and decrease as the sucrose solution increases. This shows my original prediction was correct.
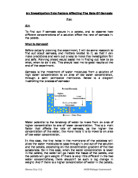
In osmosis there will be a point where the concentrations of water inside and outside the potato cells are equal (isotonic). At this point there will be no change in the length, volume and mass of the potato, as the net movement of water will be zero, no osmosis has occurred. This means on my graph the line would meet the horizontal axis showing no net movement and equal concentrations.
Using a graph I have now plotted for my results I could accurately predict results for any sucrose solution between 0 and 1 moles using my line of best fit.
Evaluation
I have managed to prove my original theory on how factors affect the rate of osmosis. My results show the larger the concentration of sucrose solution the smaller the mass of the potato chip became. Really I should have used a series of more concentrated sugar solutions as I can only prove so much of my theory as all, 5 readings showed an increase in mass. For a more reliable investigation perhaps I should have used some solutions, which would have produced a % loss in mass. This would have furthered my experiment and improved the quality of my evidence, as I would have been able to plot more points on my graph.
I did find one anomalous result for 0.4 moles, which could have been obtained for reasons described in my results. Looking at my results either side of 0.04m, I would have expected the % change to be about 46% so it would fit on the graph with the line of best fit. I do however, not believe this result to have had a detrimental effect on my final results.
I also found my first set of readings unhelpful but as I had done 2 sets of readings I could take an average of the two to make my results more reliable. This did mean my overall percentage increase might have been slightly different, as these results would have affected them.
If I did this experiment again I would be more careful in my setting up the experiment to ensure my results would be accurate. I had problems cutting the potatoes so they may have ended up slightly different sizes, which would account for any anomalous results. Another reason the results could have occurred may have been because the potato cores were not completely submersed in the sucrose solution. The final weighing may have not been accurate as not all the cores were blotted dry properly before weighing. Sugar solution sticking to the core would have increased the final mass artificially. To eliminate this bias I could have invented a universal blotting regime or measured length increase instead of mass.
For a further experiment I could have investigated the effect other factors had on the rate of osmosis. The temperature of the water in the sugar solution is one. It would prove that the protein in the potato membrane denatures after the optimum temperature (usually about 35 degrees c.) and osmosis would no longer occur as the membrane is destroyed. Another factor that may have been investigated could be the increase in length of potato chip.
Bibliography
Biology nelson science; by Michael Roberts.
Lonsdale/AQA study guide; edited by Mary James.
Encarta encyclopaedia; 2001 version.