Prediction:
I predict that when changing the concentration of the acid, the reaction will go faster. This is because the more concentrated the acid is, the closer together the particles will be. This means that collisions will occur more often.
When predicting what will happen when I change the surface area of the limestone chips, I predict that as the surface area increases the rate of reaction will slow down. If the limestone is broken down into smaller pieces, there will be a bigger surface exposed for the acid to bump into.
Apparatus:
- Retort stand
- Conical flask
- 2, 500cm3 beaker
- Tube to catch the gas
- Distilled water
- Hydrochloric acid
- Limestone chips
- Stopwatch
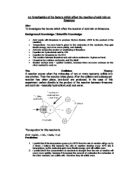
Diagram:
Method:
Concentration experiment
- Set up the apparatus as shown in the diagram above
- Fill a 500cm beaker with distilled water
- Weigh 3g of 3mm chips
- Measure 50ml of hydrochloric acid (measuring the different molarities)
- Fill the tube to catch the gas with, up to 50ml with distilled water
- Place this into the beaker, with the tube connecting the conical flask to the gas catching tube, inside the tube
- Put the limestone chips into the conical flask and then add the acid
- Quickly place the bung in the flask and start the stopwatch
- Time the experiment until all the water has gone from the tube
- Repeat this 3 times for each molarity
Surface area experiment
- Keep the apparatus set up the same as in the other experiment
- Use the same quantities as before however, keep the molarity of the acid at 2 moles per litre, and change the size of the limestone chips
- Complete the experiment exactly as before, repeating each size of limestone chips 3 times
Fair testing:
We kept the amount of acid the same and the amount of distilled water used the same in both experiments. In the concentration experiment we kept the surface area of the limestone chips the same, and in the surface area experiment we kept the molarity of the acid the same. The dependent variable in the concentration experiment were the different strengths of acid, whilst the independent variable was the temperature of the acid – this was dependent on the temperature of the room. The dependent variable in the surface area experiment was the size of the limestone chips, whilst again the independent variable was the acid temperature.
OBSERVING SECTION
Results:
A table to show the time taken for different concentrations of acid to produce 50cm3 of carbon dioxide
A table to show the time taken for different size chips of limestone to produce 50cm3 of carbon dioxide
A table to show the rate for different concentrations of acid to produce 50cm3 of carbon dioxide
A table to show the rate for different size chips to produce 50cm3 of carbon dioxide
ANALYSIS SECTION
Conclusion:
My results that I gained during the experiment are accurate, and my graphs are what were expected. The graphs to show the time taken for the different concentrations of acid and different size chips to produce CO2 were slightly curved, whilst the rate graphs for both were directly proportional. The time taken graph curved down and the rate graph went in a straight line up for concentration of acid. This tells me that as the concentrations of acid increased, carbon dioxide was produced quicker and that the rate increased as the concentrations increased. The surface area graph curved up for the time taken graph and went straight down for the rate graph. This tells me that as the surface area increased so did the amount of time taken for CO2 to be produced, and that the rate decreased as the surface area increased.
The tightest range bar on my graphs is on the rate graph for concentration. It is at 0.5 moles per litre with the lowest value being 0.0073 and the highest value being 0.0077. This is due to 0.5 moles being the lowest concentration used, because there are less acid molecules in the solution, and there will be fewer collisions. Therefore the reaction will be slower and fewer inaccuracies can take place.
The reason that the surface area graph increases is because as the size of the chips gets bigger, there is a larger surface area for the acid to erode. The graphs both agree with my prediction for surface area as I said that the rate would decrease and this happened.
The concentration of acid graph decreases because as the concentration increases, the reaction between the acid and the limestone increases. The graphs both agree with my prediction for the concentration of acid because I said that the rate would increase and this has happened.
EVAULATING SECTION
Evaluation:
To improve the accuracy and reliability of this experiment I could do more repeats of the experiment and also include different variables. One of these could be the temperature of the acid. I could heat the acid to different temperatures and see if this would affect the rate of reaction.
I think that my results were very accurately recorded because the number of factors of fair testing that we took into consideration ensured that it would be precise. Therefore I didn’t have any anomalous results.