-
Temperature. If the temperature of hydrochloric acid is increased or decreased and then calcium carbonate is added the rate of reaction will in turn increase or decrease accordingly. This is because temperature supplies the particles with energy, therefore if the temperature is increased the rate of reaction shall also increase and if the temperature is decreased the rate of reaction shall also decrease. This is because as the temperature rises, the particles shall move quicker thus colliding more often.
-
Surface Area. Increasing the surface area of calcium carbonate (by making the particle size smaller) would increase the rate of reaction. This is because, when the pieces of calcium carbonate are smaller, more surfaces are exposed to the hydrochloric acid allowing more reactions to occur simultaneously. However if there are fewer surfaces exposed reactions would only be able to take place on fewer surfaces at the same time, so the rate of reaction would be lessened.
-
Concentration. A reaction can be made to go faster or slower by changing the concentration of a reactant. If the hydrochloric acid is less dilute (more concentrated), the reaction shall be quicker. This is because the particles are closer together so there is a greater possibility of them colliding. So when the particles of hydrochloric acids are made less concentrated by adding water, the particles are going to be further apart and less in quantity so colliding with a calcium carbonate particle would be less likely.
I have decided to experiment on the latter factor. I have chosen this specific factor because it is the easiest to control and change. Controlling the temperature would require a thermometer, Bunsen burner and maybe other equipment and even then it would be very difficult to control the temperature because temperature declines rapidly when there is a significant temperature difference. Also it is not possible to keep the surface area exactly the same because there shall always be slight variances in the size. Some powdered calcium carbonate may have the same surface area as some marble chips. Concentration can easily be changed (simply changing the amount of water and acid using a measuring cylinder).
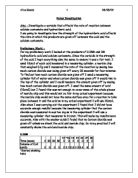
When the concentration is really low, although the experiment shall take a long time, it doesn’t mean that the reaction would not occur. When the concentration is decreased to a certain point, any less would appear to react in the same amount of time, although in reality, it would be slightly less. Similarly when the concentration is very high the reaction shall be very quick but still some amount of time is taken, even though it is very little. So when the concentration is very high, any higher would seem to have taken the same time, whereas it really took slightly less time. This is why I predict there shall be two extreme points on my graph where it seems that the line become straight but, in reality, it is either increasing or decreasing with a very slight difference. This type of graph is called an exponential graph, which looks something like this:
Rate of reaction is ‘inversely proportional’ to the time taken. This means that the rate of reaction is proportional to 1/time. The graph of the rate of reaction would be a straight line because it is acknowledged that as the concentration increases, the rate of reaction will also increase. When there are twice as many particles of hydrochloric acid in a given area, this would mean the collisions would be twice as likely to happen. Therefore the rate of reaction will double if the concentration doubles. In addition when the concentration is naught no reaction will take place. Therefore the rate of reaction will also be naught. Judging from this, I predict that the graph for the rate of reaction would be like this:
Diagram
Apparatus
- Conical flask
- Water
- Hydrochloric acid (2M)
- Calcium carbonate (marble chips)
-
Measuring cylinder (25cm³) 2
- Measuring cylinder (250cm³)
- Weighing scale (accurate to 2 decimal places)
- Weighing boat
- Tube
- Bung
Method
The values and substances chosen (using the preliminary experiment):
- 1 gram of calcium carbonate is suitable because enough carbon dioxide is produced and not too much is wasted.
- Marble chips are more suitable than powdered calcium carbonate because the latter reacts too quickly and would, therefore, be very difficult to time.
- 2M of hydrochloric acid is more suitable than 0.5M because the latter causes the reaction to be too quick – I guessed this because when using 2M, the reaction was OK and increasing the concentration would cause the reaction to go too fast.
- The preliminary experiment showed that the results between the range of 0 – 40 cm³ of water with 10 – 50cm³ hydrochloric acid (making 50 cm³ in total), is suitable to react with calcium carbonate because they neither react too quick, nor too slow.
The procedure
- Measure 10cm³ of hydrochloric acid in a small measuring cylinder (25cm³).
- Pour the hydrochloric acid into the conical flask.
- Measure 40cm³ of water in a large measuring cylinder (250cm³) and pour this into the conical flask also. This is done to keep the total volume of the solution 50cm³
- Connect the tube to the conical flask and place it in the trough of water (containing water up to about half way up the trough).
- Dip the other small measuring cylinder in the water until it fills up with water. Thereafter, assuring the top end (the open part) of the measuring cylinder doesn’t leave the water, place the tube into the measuring cylinder.
- Put a weighing boat on the weighing scale and zero it (i.e. make the reading on the weighing scale 0). Then measure 1 gram of marble chips on the measuring scale.
- Holding the weighing boat (containing 1 gram of marble chips) at an angle, place its contents into the conical flask. Immediately, put the bung on tightly and begin timing.
- Stop the timer when the measuring cylinder empties to 10cm³. Now record the result in the results table.
- Remove all the remaining substances in the conical flask and rinse out the measuring cylinders.
- Repeat all 9 steps again 2 more times.
- Do the same for:
- 15cm³ of hydrochloric acid and 35cm³ of water
- 20cm³ of hydrochloric acid and 30cm³ of water
- 25cm³ of hydrochloric acid and 25cm³ of water
- 30cm³ of hydrochloric acid and 20cm³ of water
- 35cm³ of hydrochloric acid and 15cm³ of water
- 40cm³ of hydrochloric acid and 10cm³ of water
by changing the amounts mentioned in steps 1 and 3.
Fair test
To ensure that the test is fair (so that the results are accurate and not changed), all factors which affect the rate of reaction must remain the same throughout all experiments except for the variable which is the concentration of hydrochloric acid.
To do this, the following should be implemented:
- To keep the temperature the same, do all experiments at room temperature which is currently 22˚c.
- To keep the surface area the same, ensure that all marble chips used are almost identical (in size and shape).
- To assure that no catalyst is added, do not add any other substance in the conical flask, other than the required amount of hydrochloric acid, water and marble chips.
Another factor which must be considered to assure that the practical is fair is consistency. The people (the experiments shall be done in pairs) specified to a particular job or particular jobs (e.g. timing, measuring, weighing) should be the same throughout the entire practical. This is to ensure that the slight or even major differences in people’s eyesight and speed of reaction do not affect accuracy in the results.
Safety
Safety measures which should be followed to ensure the practical is done in a safe environment are:
- Wear goggles – in case hydrochloric acid falls on eyes.
- Washing hands regularly – hydrochloric acid may accidentally, unknowingly, spill on hands. It is a corrosive material so could cause damage to the skin.
Results Table
*The experiments were based upon the time taken for 10cm³ of carbon dioxide to be produced. This column (showing the rate of reaction) shows how much carbon dioxide was produced every second. Because the average time shows how long (on average) it took for 10cm³ of carbon dioxide to be produced and the rate is concerning only one cm³ (in this case), the former had to firstly be divided by 10 (to find how long it took for 1cm³ of carbon dioxide to be produced) and then that number divided by 1 to get the rate of reaction in cm³/s.
Graphs
Concentration of hydrochloric acid (as a percentage) against time
Concentration of hydrochloric acid (as a percentage) against rate
Analysis
The concentration of hydrochloric acid was increased and a commendable pattern was observed. The results show a steady rise in the time taken to react, as the concentration is decreased. This is the same as stating that there is a steady decline in the rate, as the concentration is decreased. The results clearly substantiate the predictions I made earlier, which were justified by scientific reasoning. The same theoretical understanding can be used to show why the results were like this.
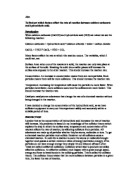
As mentioned previously, the alteration of the concentration of any reactant will, affect the rate at which the reactants take to produce the final product(s). This is because the particles are closer together and are more likely to collide. Consider the following diagram:
There are twice as many particles present in beaker A so there is twice the chance of these acid particles colliding with the marble and causing a chemical reaction to occur
Judging from this, we can conclude that a higher concentration of hydrochloric acid shall consequently cause more collisions to occur which in turn increases the rate of reaction.
In my prediction I briefly outlined 2 simple graphs (for time and rate) and why I felt they were going to be similar to the outcomes. The graphs are very similar to those that I predicted. If the concentration was decreased further, it would seem like the time would be only slightly less (judging from the curve of best fit) and vice versa. This is as I predicted in my prediction. Also the rate shall increase in the same pattern if the concentration was further increased or decrease in the same pattern if the concentration was further decreased (as can be seen from the line of best fit).
The time for 5 hydrochloric acid particles to react with calcium carbonate when only 5 particles are present (as in beaker B above) would be longer than the time for 5 particles to reacts when 10 particles are present (as in beaker A) because in the latter there are more particles in a given volume so there is a greater chance of them colliding. However if the concentration is continuously increased, there would eventually come a point wherein any further increase in concentration would cause the time difference to be very minute because the rate is so high. Similarly when the concentration is very low, there shall be a lesser chance of the particles colliding. When the concentration is further decreased (excluding zero), although there shall be a change, it shall be very minute. This is why there are two extreme points on the time graph where it seems the values would be same (if the curve of best fit would be continued) whereas in reality they are increasing or decreasing with a very slight difference.
The rate graph, however, is a straight line. This is because the rate shall always increase when there are a greater number of particles in a given volume. This is because when there are more particles collisions shall occur quicker. However when the rate is very high an increase in the rate would not affect the time dramatically. Similarly when there is a very low rate a decrease in the rate would not affect the time significantly. This is why there is a difference (in the shape of the line of best fit) in the time and rate graphs.
In conclusion, my findings establish the principle that by increasing the concentration of any one reactant in a reaction, the reaction shall subsequently become quicker.
Evaluation
I am pleased with my results. The results showed accuracy and the variances in the figures were minute. However I believe some minor errors may have occurred during the practical which affected the results slightly.
Firstly the accuracy in the readings of time, amount and weight may have been slightly distorted due to carelessness, wearing goggles which are not clean or simply unintentional misreading. To ensure this problem does not occur in the future, the person should read the measurements in the measuring cylinder, ensuring they are read at eye level and not at an angle because this could be misleading. Also the person should wear clean goggles through which sight is clear. The person should try to time as accurately as possible, starting and stopping at the same time in every experiment.
Secondly the temperature at which the experiments were carries out was at room temperature. Room temperature could have varied during the day corresponding to sunlight (through the window), heating, air conditioning etc. To reduce this problem, the curtains (or blinds) should be closed and the heating or air conditioning (or anything else which affects temperature) should either be off or level during the whole day.
Two things that affect the reaction and were not considered are the tightness of the bung and the firmness of the tube on the conical flask. They may have varied during the practical and great precaution should be taken ensuring they have the same grip in future experiments. If these two objects are loose carbon dioxide could be released into the air, so the best is to try and put them as tight as possible.
During the experiment hydrochloric acid and water was spilt. This was not taken into account. Although this isn’t regarding the accuracy of the evidence, it plays a vital role in safety during the practical. Tissues should be provided.
Another important factor which could have easily changed the results is the temperature of the water added to the hydrochloric acid. Regarding its temperature no arrangements were made to keep it controlled. The water used should always be taken from the same tap.
Another aspect which wasn’t considered was the gas that was already in the tube and the conical flask. When the calcium carbonate was placed in the conical flask, these gases were the first to appear in the measuring cylinder, therefore exactly 10cm³ of carbon dioxide wasn’t measured.
If the line of best fit was extrapolated, it wouldn’t reach the origin. This is not accurate because it is obvious that when the concentration is zero the reaction would not occur so there would be no rate of reaction. All the errors mentioned previously may have contributed to this inaccuracy.
Another thing which could be done to get more accurate readings is to repeat the experiment several more times so a decisive average could be obtained.
Also to get more accurate results, rather than altering the concentration by diluting it, varying molar solutions could be used e.g. 0.5M, 1M, 1,5M, 2M etc. This will give more accurate readings because the concentrations are decisive and a lot less doubtful than diluting the hydrochloric acid.
In attempting to further this investigation, many areas could be explored.
The other factors which affect the rate of reaction (other than concentration) between calcium carbonate and hydrochloric acid namely the temperature of the hydrochloric acid and the size of the calcium carbonate pieces (surface area) could be further investigated by varying their amount to see to what extent they affect the rate of this particular reaction. To experiment on how temperature affects the rate of reaction all factors should remain the same except the temperature of either the room or the substance (i.e. the hydrochloric acid) by heating it and the difference in the rate at which the reactants react should be observed. Likewise, when testing the surface area the size of calcium carbonate should be changed and how the rate changes should be observed.
In addition to this the current factor (concentration) could be further experiment with to get better and more accurate evidences. The range I used was 10-40cm³ of hydrochloric acid in a solution with the total volume of 50cm³. The missing quantities (i.e. 0cm³, 5cm³, 45cm³ and 50cm³) could also be experimented with. Also I did the experiments in intervals of 5 and added a curve of best fit. However I cannot be certain that the readings in an actual practical would be exactly along the curve so rather than doing intervals of 5, intervals of 2 or 3 would give more accurate and precise results.
As regards to my final results and findings, I am pleased by its accuracy and recommend this procedural method of executing further experiments of a similar nature.