A catalyst works by giving the reacting particles a surface to stick to where they can bump into each other. This obviousely increases the chance of a collision to occur.
Preliminary work
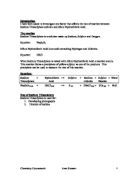
For my preliminary experiment I carried out the experiment I was going to do as my main one, but on a much smaller scale. I decided to carry it out at three different concentrations.
As you can see from my results above the time taken for the cross to disappear increases as the concentration decreaes and the time taken decreased as the concentration increased.
For my main experiment I am going to use 20 cm3 of both hydrochloric acid and sodium thiosulphate. I will be changing the concentration of the sodium thiosulphate, the way in which I shall do this is by adding water to the concentration of the sodium thiosulphate solution I will carry out the experiment using eight different concentrations. This wide range shall give me a more accurate graph. Temperature is a factor, which affects the rate of a reaction so I will put a thermometer in the room and see if it changes. I will use a burette to measure out the volume of the dilute water, the sodium thiosulphate and the hydrochloric acid.
These are the concentrations I will use
Prediction
I believe that as the concentration of the sodium thiosulphate increases the rate of the reaction will increase causing the solutions of the hydrochloric acid and the thiosulphate to trun yellow more quickly. This means that the time taken for the cross to disappear will decrease. A the concentration of the sodium thiosulphate decreases the rate of the reaction will decrease causing the solution of the hydrochloric acid and the thiosulphate to turn yellow more slowly. This means that the time takne for the cross to disappear will increase. This means that the rate of the reaction should be directly proportional, so the graph should be a straight line. I believe this to be due to my preliminary experiment, which I have carried above and by the backrounf information, which states, that if the solution is made more concentrated it means that there are more particles of reactant knocking about between the water molecules which makes the collisions between the particles are more likely. I also believe that as I double the concentration the rate would also double.
Method
Firstly I will draw a cross on a white tile using a marker pen. The using the burette I will measure out of 20 cm3 of hydrochloric acid and pour it in a conical flask. Then I will measure out the concentration of the sodium thiosulphate solution. Then I will pour the solution into the conical flask and as soon as the first drop of sodium thiosulphate drops on the conical flask I shall start the stopwatch. Looking directly above the conical flask I will wait until the cross disappears and then stop the stopwatch.
Apparatus
Conical flask
Hydrochloric acid
Sodium Thiosulphate
Dilute water
3 Burettes
white tile
Per,manent marker
Stopwatch
2 Beakers
Diagram
Results
Safety
I must ensure that I carry this experiment out safely as hydrochloric acid is an irritant and it is corrosive. Also the fumes which are given off are toxic, so I must ensure that as I finish carrying out the experiment I place the solution in a fume cupboard. I will also wear a lab coat and a pair of safety goggles.
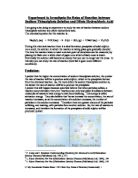
Analysis
The results above, which I have obtained, have proved my prediction right. I said that that as the concentration of the sodium thiosulphate increases the rate of the reaction will increase causing the solutions of the hydrochloric acid and the thiosulphate to trun yellow more quickly. This means that the time taken for the cross to disappear will decrease. A the concentration of the sodium thiosulphate decreases the rate of the reaction will decrease causing the solution of the hydrochloric acid and the thiosulphate to turn yellow more slowly. This means that the time takne for the cross to disappear will increase. This is in fact what happened during my main experiment.
I said that my reaction would be affected by the collision theory, which in this case was theory of concentration, which said that if the solution is made more concentrated, this means that there are more particles of reactant knocking about between the water molecules which makes the collisions between the particles are more likely.
I have had one major anomalous result and that as concentration 0.8 mol/dm3. As you can see the line of best fit goes up in a strait line. As you can see the point is very far out. This is a clear anomaly. I would have expexted the poin to be at arround 0.125. Other than that there are no clear anomalies, but I still should have taken more readings just to make sure my graph is more reliable. This would also enable me to make further predictions in the future. There is a definite trend in both my graphs. In my rate of reaction graph the rate increases as the concentraion increases and in my other graph the time taken for the cross to disappear increases as the concentration decreases. This in fact proves my prediction right.
I monitored the temperature, as it is a factor, which affects the rate of a reaction. There was no significant change in the temperature, so I can say that that factor didn’t affect my experiment.
Evaluation of main experiment
My experiment was well carried out as there weren’t many anomalous results. To get even more reliabe results I should have carried out this experiment at more concentrations and I should have done more repeats. I could have carried out this experiment at 14 different concentrations and I could have done 5 repeats. This ould have made my experiment very reliable and would have made my graph more acurate. It would have made my graph more accurate as there would be more points plotted on it. Another way in which I could have had anomalous results was by stopping the stopwatch early or too late. I could have also meausref the wrong concentration, this would have either increased or decreased the rate of my reaction.
I believe a more accurate way in which I could have carried out this experiment was by using the light sensor, which is attackes to the data-logging computer. The way in which it works is that the computer measures the percentage of light, which is picked up by the sensor. The reaction stops when the reading on the computer goes down to 0%. This is a more reliable way in which to carry out the experiment as there is no chance of a human error to be made andd practically no chance of there being a computer error.
For my furhter work I could have also done this experiment at a higher temperature. This would have probably increased the rate of the reaction. This is because when the temperature is increased the particles all move quicker. If they’re moving quicker, they’re going to have more of a chance of a collisions to occur with eachother.