“As the length increases, the resistance across the wire should increase directly proportionally.”
Prelim Experiment
Aim
The aim of this prelim experiment is to find a suitable wire to use for an experiment to determine how resistance is affected on a length of wire.
Equipment
6 Wires
1 Power Box
6 Types of metal wire 100cm long (Thin, Medium, Thick Copper and Thin, Medium, Thick Constantine)
Ammeter
Voltmeter
2 Crocodile Clips
Ruler
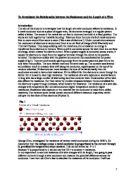
Diagram
Method
- The first thing to do was to set up the experiment as shown in the diagram.
- The circuit was left unfinished until it was checked then put together.
- The length of thin copper wire was measured to 20 cm and the crocodile clips were attached to the 0 cm mark and 20 cm mark.
- The Power was turned on for a few seconds to mark down the voltage using the voltmeter and the current using the ammeter.
- The same was done for each of the wires at 20cm and 100cm.
- The results are then taken down the table.
Fair Test
To make this prelim useful it must be a fair test. There are a few things we must keep constant in this test to make sure we get correct results. We have to make sure the temperature stays constant. To do this we make sure we only turn on the power for a few seconds and we also leave a little gap between readings to minimize any possible heat rise. This is because, when a wire is hotter, the particles move around more. This means that there are more collisions slowing the electrons down. This increases the resistance, which is what we are trying to measure accurately so this would ruin the experiment. Another thing that should stay constant is the Voltage supplied to the circuit. For this I shall be using 2 volts but it may change if the wire gets hot.
Variables
The variables are:
- Current in circuit
- Voltage across wire
- Resistance in wire
- Thickness of wire
- Material wire is made of
- Length of wire
Results
Conclusion
From these results I can easily establish which wire I will be using. I will use the thick Constantine wire. This is because it has the widest range of results. 0.64 to 1.17 is the biggest difference of all the voltages as was 0.62 to 0.24 in the current so it is the obvious selection.
Main Experiment
Equipment
1 Thick Constantine wire
1 Voltmeter
1 Ammeter
2 Crocodile clips
1 Power box
6 wires
1 Ruler
Masking Tape
Heatproof mat
Variables
These are the variables in the main experiment. Length.
These are the constants. Voltage supplied, Thickness, cross-sectional area, Temperature, and Material.
Diagram
Planned Method
- Set up the circuit as shown in the diagram.
- The length of wire is taped tightly to the 100cm ruler.
- Crocodile clips are put at the 0cm mark and 20cm mark
- A reading is taken of the current and voltage.
- The current is turned off quickly to prevent and possible temperature.
- This is repeated twice to ensure accurate results.
- This is repeated until we reach 100cm at 10cm intervals (20,30,40…)
- The results taken are turned into 3 resistances for each length and an average is found for the 3 tests.
- This is finally drawn up on a graph with a straight line.
Safety
There are a few points of safety to observe when carrying out the experiment. We must make sure the wire doesn’t get hot. To do this we only use a voltage of 2 in the power box and see if it is getting red hot, then we touch to see if there is any temperature rise. We also use a heatproof mat to prevent the table getting damaged.
Results
Analysis
I can analyse a lot about this experiment and its success. There were several problems I had in the experiment that could have lead to inaccurate results. First of all, the length itself may have been wrong. Since the wire was not perfectly straight against the ruler it could be a small amount out which would affect the resistance, which would put points off the line on the graph. Given more time, this wire could have been perfectly straightened and more time could have been spent making sure it was flat against the ruler. Also, to do with the ruler, that might not be perfectly made and human error could occur from reading it.
The connections were another problem. The connections would have to be put perfectly on the cm mark to ensure complete accuracy and it is also unsure whether they made a good connection. This could almost add up a cm out which is a lot out of 10cm for each interval. Given more money, and time, the joins could have been made more precise.
Despite my results being all on the line, we cannot say that this means resistance is always directly proportionally to length. My results are extremely limited. I used just 1 material, 1 thickness, 1 voltage and 1 temperature. There are many different combinations that could have yielded different results.
I can, however, establish some things about resistance and length from my data. For thick Constantine wire, resistance and length are directly proportional. We could then generalise that this is the case for all wires since different wires would just give the resistance a multiplying factor. We can also see that, when wires length increases, the voltage increases and the current decreases which causes a higher resistance.
To improve the experiment I could have done several things. The voltmeters and ammeters are only to a few digits. Much more precise voltmeters and ammeters would give a better and more precise resistance leading to the points being even more precise on the graph. Also, another thing to improve the experiment was to do more repeats. The more repeats we do, the more reliable the average is as anomalies make a smaller difference. However, this requires a lot of extra time so would be quite hard to actually use.
Evaluation
I was fortunate to have no anomalies in my experiment. An anomaly would be where 1 result is a long way out. On my graph, the points were all on the line (or very close to) so there were no obvious anomalies. Generally, none were out by more than 0.05 ohms, which is a very low amount and is probably due to the equipment not being accurate enough. With better equipment, these would probably no longer be there as the resistance would be more precise.
All in all, I would say the experiment went well. I was able to obtain results quickly and accurately. Also, I believe I performed the experiment in a safe manner using the guidelines given. I was able to establish how length and resistance are directly proportional to each other which was that aim, so this was a good point.
There were a few things I could have improved on. One major thing was that I did not start my coursework as early as I could have. I f I started earlier, it would have been more polished and detailed. In the future I should aim to start earlier to spread the work over the entire time.