Safety
The experiment is relatively safe, however the equipment is expensive. The BBC computer must be set up correctly and used sensibly as it is expensive and irreplaceable. The glider and air track are also expensive and must be secured firmly on to the bench. The glider must be stopped before it hits the end of the air track, this is because the glider will be travelling at a high velocity and if it hits the end of the track both the glider and the track may be damaged. The light gate must be held firmly with a clamp and a stand, at the appropriate height and not allowed near the edge of the bench. This is because if it falls out it will damage the light gate. All equipment must be kept as far away from the edge of the bench and secured. The blower must be controlled sensibly, if it is miss used it may damage the blower.
Difficulties
The experiment caused little difficulties because it was pre-designed and set up. However the data range of distance from light gate had to be chosen by us. We decided on a range of 1000mm to 500mm from the light gate. This is because below 500mm the light gates readings become very inaccurate and fluctuant between readings, therefore giving a poor average result.
Results
See results and page and.
Analysis of results
The graph that the results provide was a straight-line graph this was no surprise because I had calculated this outcome.
If I was to use the suvat equation V2=U2+ 2AS, this would give me all the information I needed however to then manipulate this into a straight line graph I would have to rearranged the equation to fit Y=MX+C. I can do this because A= a constant U= a constant V= a variable and S= a variable therefore the variable would be on the axis. This is how the equation can be fitted and used to find a straight line.
-
V2=U2+AS this is the original equation.
-
V2-U2=2AS the initial speed has been subtracted from the finish speed this is the equal to 2AS.
-
I have divided initial speed and start speed by acceleration to give distance.
-
V2=U22S+2A once at this stage a straight-line relationship becomes more apparent.
-
V2=U2S+A I have subtracted 2 from both the distance and acceleration and from this I can show the relationship between the straight-line graph and the equation I have used.
-
V2=U2S+A
Y= MX+C this shows what will be plotted on the axis and which values are constant.
From the graph that has been produced I can predict that because U is a constant then it will always go through the origin. Because the graph shows a resultant of a straight line we can induce, as the distance increase the speed when the light gate is broken will increase proportionally.
Sources of error
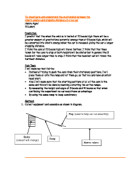
The aim of the experiment was accomplished, however the results could have been more accurate. Firstly, the experiment was set up on an air track and the glider used, this was done to remove the force of friction and indented to balance all other forces acting on the glider. However to calculate the relationship of speed and distance we should have considered and compensated for all other forces acting on the glider such as gravity, and the force that is acting in the opposite direction to that of the glider. If I were to repeat the experiment I would consider this factor. This would improve my results because by calculating the unbalanced forces I could attempt to reduce them.
The card was measured with a ruler this was done because the information had to be given to the computer for it to calculate the velocity. However the method of measuring this could of created a parallax error. To improve the accuracy of the results I would repeat the experiment and use a more accurate measuring devise such as an adjustable ruler. This would eliminate the parallax error another source of parallax error was when measuring the distance of the starting edge of the card that was placed into the glider, to the light gate. Even though we tried to reduce the parallax error by measuring as accurately as possible, the level of the leading edge of the card and the correct measurements on the ruler there would still be a degree of error. To eradicate this error we could have used a ruler that went vertically from the card to the distance from the light gate ruler. This would measure a straight line from the top right hand corner of the card to the ruler this would increase the accuracy of the distance from the light gate measurement, and would improve the accuracy of the graph. The experiment could have been analysed using energy distribution if I was to use energy distribution I would of also obtained a linear graph that passes through the point of origin.
Conclusion
I conclude that the experiment has accomplished the aim of the experiment however there is room for improvement for the accuracy of the results.
The S.U.V.A.T equation that can be used to predict that the graph would be a straight line is V2=U2S+A. this can also be used to calculate any velocity for this experiment as long as the distance, acceleration and start speed are all known.
Bibliography
- As revision guide – WH smiths, forces acting on glider and suvat equation information
- As text book- provided back round information
- As Cd rom- course work structuring information and information on equations