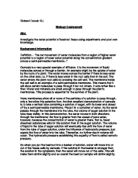
If the solution in the beaker is weaker than the solution in the beetroot cells then the water will move from the solution and into the cells. This will make them swell slightly and the sample get bigger.
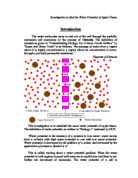
The above diagram is a molecular model of osmosis in action. The dotted line, which separates sides X and Y, is the partially permeable membrane.
The water molecules (B) are more densely concentrated on side Y this means that in accordance to the osmosis rule the B molecules will move from side Y to side X. The sugar molecules (A) will not flow from side to side as they posses too much bulk to get through the membrane. The flow of (B) molecules will continue along the concentration gradient until the osmotic pressure has reached equilibrium and the concentration is equal on both sides.
Pure water has the highest possible water potential. The effect of solute molecules therefore lowers the water potential. The water potential of water is set at zero. Since solutes lower the water potential, the water potential of solutions must have negative values the more solute in a solution the lower the value. The amount that the solute lowers the water potential of a solution is called the solute potential. It is therefore always negative. The symbol for water potential is the Greek letter psi (ψ) and the symbol for the solute potential is ψS.
There is another factor, which effects the water potential which is pressure potential (ψP) The pressure potential is the pressure applied to the container, the greater the pressure applied the greater the tendency for water molecules to be forced back against the concentration gradient. By increasing the pressure potential the water potential is also increased. It increases the water potential and is therefore positive.
Water Potential is equal to the Solute Potential plus the Pressure Potential
ψ = ψS + ψP
Once the experiment has been carried out the Water Potential of the beetroot must be determined; this can be done by using this table which shows varying concentrations of sucrose solution against their Water Potentials:
Prediction:
I predict that
- the beetroot cylinder in the solution with the strongest concentration will lose the most mass and that
- The beetroot cylinder in the solution with the weakest concentration will gain the most mass.
This is because the high Solute Potential of sugar molecules will mean a larger displacement of water molecules. Therefore the solution will have a lower Water Potential compared to the beetroot because of this the water molecules will move from the beetroot to the solution.
Variables
The factors that would influence the rate of osmosis are: -
- The ratio of surface area/volume of the beetroot.
- The amount of solution in the test tube.
- The strength of the solution in the test tube
- The amount of time the potato was left in the test tube.
The variable that I have decided to vary is the strength of the solution in the beaker. This will enable me to determine the water potential. All the other possible variables will be kept constant to make each experiment fair and to enable me to get accurate results recorded.
Fair Test:
- All twenty-one beetroot cylinders must all be taken from the same beetroot.
- Separate test tubes and measuring cylinders must be used for each solution, this is to avoid any contamination.
- Must be a new piece of Toilet Tissue used to dry each beetroot sample and the samples must be dried lightly and not squashed.
- The same volume of solution must be used per concentration.
- The beetroot cylinders must be trimmed to the same length.
Safety Points
- Be careful especially with the knives when cutting the beetroot.
- Be aware of other people around you.
- Make sure you are clear on what you are doing.
- Don’t play with the equipment especially in a science lab.
Equipment
- 5mm Cork-borer.
- Seven beakers.
- Timer.
- One measuring cylinder.
- Electronic scales.
- Sharp Knife
- Red string.
- Blue string.
- Yellow String
- Twenty-one pins.
- Distilled water and 2M Sucrose solution which will be used to make seven varying concentrations 20ml of sucrose solutions which will range from 0.6 m every 0.2m up to 1.8m
A 2M solution is being used because a previous experiment using only a 1M solution showed beetroot to contain a high concentration of sugar and poor results were obtained with only 1 M being used. We decided to use a 2M solution this time round
Method
- Collect all equipment on the list
- Make concentrations of sucrose that are required: 0.6, 0.8, 1.0, 1.2, 1.4, 1.6 and 1.8 (all M)
- Using the cork borer, make 21 5mm diameter beetroot cylinders then using a knife trim them all to 2.5cm long.
- Use the electronic scales to record the mass of each beetroot cylinder
- Place a pin through each beetroot cylinder and attach a piece of string seven in each colour.
- Put one beetroot from each colour in every beaker and start timer
- Leave for 40 minutes
- Remove the beetroot from the beakers and dry with toilet tissue
- Weigh the mass of every beetroot sample and record results
- Plot graph of results
Diagram
- 5mm Cork-borer.
- Seven beakers.
- Timer.
- One measuring cylinder.
- Electronic scales.
- Sharp Knife
- Red string.
- Blue string.
- Yellow String
- Twenty-one pins.
- Distilled water.
- 2M solution.
Results
Starting mass of Beetroot
After 40 Minutes
Change in mass
Average change in mass over all sets
Graph on next page
Analysis of Results
The results show that a trend appearing that overall as the concentration increases the mass of the beetroot decreases.
There is an anomalous result, which does not follow this trend, this irregularity could have occurred for a number of different reasons. Possibly a human error maybe when the samples were being dried. The equipment may not have been sterile or something similar which would have effected the results.
Conclusion
From these results, which have also been displayed in graph form, I can see that my prediction was correct. As the concentration of water increased, the mass lost by the beetroot slowly decreased until it was actually gaining mass. This was because it had less water molecules than the solution it was in. This was able to happen because the low level of water in the strong solutions meant that the net movement of water molecules was from the beetroot, through the partially permeable membrane of the beetroot and into the solution. The stronger the solution was, the more water had to move from the beetroot to the solution. As the strength of the solution decreased, less water had to move through the membrane from the beetroot. Eventually, the solution was so weak that there was a higher water concentration in the solution than in the beetroot. This meant that the net movement of the water molecules was from the solution to the beetroot. This caused an increase in mass as I predicted.
From the graph, you see that the “average” line crosses the x-axis at 1.43M, this is significant because the zero mass change indicates that the beetroot and the sucrose concentration were in a state of equilibrium and that therefore their Water Potentials were equal. And so, by using this table of Water Potentials and Sucrose Solution Concentrations we can discover the Water Potential of the beetroot:
The water potential of beetroot is approximately –5800 kPm.
Evaluation
I am reasonably pleased with the outcome of this experiment as I feel that I have obtained some reliable and fairly consistent results.
I think that measuring the volume of solution left in the containers after the experiment has taken place would be of great benefit as it would give me more data to draw results from and better conclusions could be drawn. Another idea that could be implemented would be to repeat the experiment more times as then more data is used and more accurate averages can be obtained. An alternative route that could be taken is to calculate the beetroots surface area for each sample which could lead to varying the surface area and seeing just how much difference that it makes.
Information used from
“Biology 1” by Mary Jones, Richard Fosbery and Dennis Taylor
“Biology 2” by D.J Taylor, N.P.O Green, G.W Stout
The Internet () ()
“Advanced Biology” by J. Simpkins and J. Williams
Encarta encyclopaedia