Size of test tubes,
The room temperature
Fair test
I must make sure that I only change 1 variable. I am only going to change the amount of test tubes in a huddle, as that is what I am investigating. I will also have to change the water but I will measure the amount of water that goes in to the test tube also must make the start temperature the same.
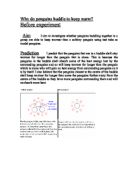
Preliminary tests
I have done a test to see what the best temperature to start the experiment off at. As I want to start the experiment off at a temperature that will give me time to set up and pour all the water in to the test tubes. Also have got to see how, much water fits in the test tubes and which size test tubes to use. I must do this to make sure that I only change one variable.
20 ml of water fits in the test tube.
I think the best temperature to start at will be 50 ºC as it gives me under 5 minutes to get the equipment ready to start the experiment.
Apparatus
9 thermometers
9 test tubes (all the same size)
Elastic band
Kettle
Water
Measuring cylinder
Stop watch
Beaker
Diagram
Method
- Set out the equipment as shown in the diagram.
- Boil kettle
- Pour 20 ml of boiling water in a measuring cylinder
- Pour that in to the test tube
- Wait until the temperature of the water is down to 50 ºC
- Start timing
- Put thermometer in all test tubes
- Check temperature every minute (write temperature in table)
- Stop timing after 15 minutes
- Repeat each experiment 3 times
- Do the same for 3,5,7,9 in a huddle.
- Work out the averages
Safety
I will be using very hot water. I must make sure that I am careful and don’t put me in any risk of spilling the water over anyone else or me.
- I must not run around with the hot water
- Must not move the water around unnecessarily as I might spill it.
Results
All these are the averages of all the test tubes in each experiment and the repeats. They will be rounded up or down to the nearest
0.5 ºC.
Start temperature 50 ºC
The difference from the start temperature and the finishing temperature got less so that means that the more test tubes together the less heat lost. Or the more penguins together and the less temperature lost.
The numbers that are highlighted are strange as all these numbers are repeated. I think this is because I could only measure as accurate to a half a degree. And also I have averaged all the results so that could be why the results are the same twice is three times. There are also some results that are out from the line of best fit. This could be for the same reason as before. The averages are strange of one of the results from the first results are out. On my graph I have also circled some results that are odd (have drop temperature a lot) this could be fore the same reason as before or I could be because I have read the thermometer wrong.
All my result could be a bit out as I took the temperature off all the test tubes so I had to average all of those out and then average the results again because I repeated all the experiment 3 times.
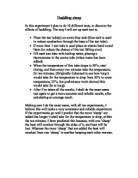
From my graph all of the lines of best fit are curved and the gradient at the top is greater than the gradient at the bottom; so the temperature went down slower the cooler the water was. all my lines of best fit, finish slightly high that the huddle with less test tubes so my experiment did work. My predictions where both right as I said that the cooler the water gets the slower the temperature will drop. Also I said that the temperature will not drop as much the more that are in the huddle which was also correct because the difference between the start temperature and the finish temperature was less the more that where in the huddle. So what I found out that if an object is over 0 ºC must radiate heat from them.
Evaluation
While doing the experiment I found it hard to take all the temperatures of all the test tubes and 1 min, 2 mins etc because it was impossible to get all the temperatures all at ones because I took the temperatures of all of the test tubes. If I did the experiment again I would take the temperature of the middle test tube and may be the outside test tube and I would compare them, as it was hard to take all the temperatures. Also I think this would have mind my result more accurate and reliable as there was not as much data to average. It was also hard to work out the average, so I had to average most things twice and this could have made my averages odd and my graph a bit odd. But most of the time the result, which I averaged, matched all the way along so that those result were accurate. Also if I had to do this experiment again I would try and get a thermometer that takes more pacific reading, as this would not.
But I think that the overall results that I have got have agreed with my predictions and have proved what I wanted it to prove. Although the results are not as clear as I would like them to have been.
This experiment was not an accurate measurement of penguins huddling and the test was not done with penguins; it was done with test tubes and hot water in a fairly warm room. This did not give us the conditions in which the penguins face. This proves to me that heat radiation is given of object so those penguins are properly the same and all so give off heat.
But my results do tell me that more things in a huddle the less temperature lost from a penguin or a test tube
Another problem I had with this experiment was to start all the test tubes off at 50 ºC as the water in all of the test tubes were slightly different temperatures, especially foe the 9 in a huddle all the temperatures varied and it was hard to decide when was the right time to start.
If I had to continue my investigation on this subject I would properly do more test tubes in a huddle because there are more that 9 in a huddle so I would be able to see a greater difference between 1 test tube and the number I go up to. and also try and work in a colder place as this would make my results a bit better I would also put some thing on the top of the test tubes to stop some heat escaping from the top of the test tube as this could have affected my results. I would do that also because penguins have a head with feathers to stop some of there heat escaping. I think I did this my results would be more reliable as the conditions would be better related to how the penguins living conditions.
If I collected more data I would be able to see how much the huddling process helps with keeping warm so I would also do teach experiment for a bit longer.
1 test tube
There are some repeats off results that will affect my averages I have highlighted the repeats.
3 test tubes
5 test tubes
7 test tubes
9 test tubes
A lot of my results are repeated cause the last couple are averages of the all the test tube s in each experiment.