Results showed that the thickest wire, of 20 SWG, got quite hot when the voltage reached 1 V. A safe voltage is 0.300 V, as the wire does not heat up noticeably. The thinnest wire, of 38 SWG, didn't increase in temperature noticeably at any voltage tried, but if the voltage is kept under 2 V, the voltmeter can be changed to a more accurate measurement setting, which goes to three decimal places. This is also useful because with a low voltage, there is also a low current, so a milliammeter can be used instead of an ammeter, to get more accurate readings.
- Checking to see if an ohmmeter gives accurate readings on the chosen length of wire by measuring the resistance first with an ohmmeter, then by dividing voltage by current, to see if the two measurements are the same.
The results showed that the ohmmeter decreases in accuracy the lower the resistance goes. With a 38 SWG wire, the ohmmeter got very similar results to those attained by dividing the voltage by the current. However, it was very inaccurate with the thickest wire, of 20 SWG, as the ohmmeter showed a difference of 7Ω than when the voltage was divided by the current. This shows that when analyzing the results, the ones taken with an ohmmeter should not be taken very seriously.
- Finding a method of straightening out the wire. There are two proposed methods:
-
Hanging the piece of wire from a stand, and attaching weights to it.
This method works well, but it must be insured that excess weight is not used, as this stretches the wire. Stretching the wire reduces its diameter, so also reduces its cross sectional area, so the measurements taken for a stretched wire are invalid. It is not necessary to use this method for the thinner wires, as they can easily be stretched out by hand using the following method.
- Straightening out the wire across a meter rule:
It is difficult to straighten out the thicker wires with this method, because a large force is needed to do so, and it is easier to provide such a force with the previous method. However, for the thinner wires, this method works perfectly, as they can be straightened out very easily.
Proposed method:
- Straighten out a 1 metre length of nichrome wire by attaching it to a stand clamped to a table and attaching weights weights to the bottom of the wire, or by pulling it across a metre rule. If the method with the weights is used, care should be taken not to let the weights fall on a person's foot, as this could seriously injure them, and the weights should be not so heavy as to stretch the wire.
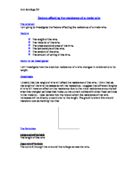
- Put crocodile clips one metre apart on the wire, and to attach them to a circuit with a power supply with a low voltage and very sensitive ammeter (or a milliammeter if the current is small enough) in it, and attach a voltmeter to the crocodile clips, as in the following diagram:
-
Take a reading from the ammeter and the voltmeter, disconnect the power supply, then reconnect it to get a second reading. Repeat this for a third reading.
- Remove the ammeter, power supply and the wires shown in the top half of the above diagram, and replace the voltmeter with an ohmmeter, and take three more readings (a current is not necessary for an ohmmeter to function):
Three readings must be taken, as if only one is taken, it cannot be known if it's anomalous, so having two others is a good check to see if one reading is skewed. The temperature, length of the wire and its material must be kept the same, as if these change, the wire's resistance could be affected, making the test unfair, as only the area of the cross section of the wire should be a factor in change the resistance. The voltage and current do not need to be kept constant, as whatever the voltage and current for a given wire, they will always divide together to get the same resistance.
The readings must be taken from accurate equipment, otherwise the results won't be very useful for drawing conclusions from, as they might need to be taken a t a greater degree of accuracy to ensure a good pattern. To ensure that they are accurate, equipment that takes readings with decimal places must be used. To calculate the resistance from the voltage and the current, the voltage must be divided by the current. To find the cross sectional area of the wire, the formula area=πr2 must be used, with the radius measured in mm, to produce an area in mm2.
There will be three results of resistance for each wire thickness with this method, which must then be averaged together, unless one is clearly anomalous. If this is the case, the remaining two should be averaged together. To plot these on a graph, 1 must be divided by each resistance, and these results plotted on the Y axis of a graph, as they are the measurements taken. The cross section area of the wire must be plotted on the X axis of the graph, as that is the controlled variable. On another graph, the same must be done with the results taken from the ohmmeter, and on a third graph, the same must be done with the values listed by the manufacturers for resistance. These three graphs can be compared, and it can be seen if the measurements taken were accurate or not.
The experiment was carried out while using the apparatus correctly and safely. When attaching weights to a suspended wire, care was taken to make sure that the wire and weights were fastened safely, so that it would not detach and spring out, striking someone in an eye. Additional precaution was taken by wearing goggles when this method was used.
When measuring the the resistance, voltage and current, the instruments used were set to their most accurate mode. For example, the voltmeter was set to three decimal place readings, and a milliammeter was used instead of an ammeter. The milliammeter was set up in series with the wire being tested, and the voltmeter in parallel with it. The ohmmeter was set up in parallel with the wire being tested, but without a current being pushed through the wire, as that is not necessary.
All variables that would affect the resistance were kept constant, except for the cross sectional area of the wire being used, as that is the variable being tested. A low voltage was used with all of the wires, so that they would not heat up, and all wires were kept to 1 metre. However, the voltage and current did not need to be the same for each wire, as whatever the voltage and current in a wire, the resistance is always the same.
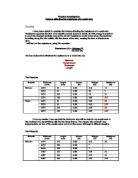
Using instruments with accuracy to several decimal places, three readings were taken with a voltmeter and an ammeter on each wire to calculate the resistance, and three readings with an ohmmeter were also taken on each wire. Three readings were taken because it is easy to see if one of the three is anomalous, and can be ignored when drawing graphs. Ten wires were tested, to have a good number of results, with diametres from 0.16mm to 0.90mm, which is a big enough range to be able to plot a reliable graph. No changes to the plan were needed to be made after all of the readings ha been taken.
Analysing data
Conclusions
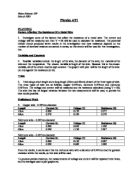
This is a graph showing the manufacturer's values for resistance and cross sectional surface area:
As can be seen, the points line up with a straight line going through the origin, and the resistance values are divided by one. This suggests that the resistance is inversely proportional to the cross sectional area, so if the cross sectional area doubles, the resistance will halve.
For resistance calculated by dividing the voltage by the current:
On this graph, the first nine values appear to be in a straight line, indicating inverse proportionality, but the tenth value does not line up. To test this, a graph was plotted without the tenth value:
Here, it can be seen clearly that the points line up, so there seems to be an inverse proportionality between resistance and cross sectional area. This is because the line is straight and goes through the origin, and if one variable divided by one plotted against the other results in a straight line that intercepts the origin, there is an inverse proportionality. Inversely proportional means that there is not a linear relationship between the two variables, rather if one doubles, the other halves.
For resistance measured with an ohmmeter:
As predicted, with a low resistance, the ohmmeter was inaccurate, so the final two points must be ignored to be able to read the graph correctly:
Here, the points clearly line up, suggesting an inverse proportionality, for reasons detailed above.
Overall conclusion:
The results and conclusions agree with my prediction: there is an inverse proportionality between resistance and cross sectional area in the wires tested. The agreement is quite good, except that there are anomalous readings on the graphs, and with them, resistance and cross sectional area do not appear to be inversely proportional. However, ignoring these values, the conclusions completely match the predictions.
Evaluating Evidence
My results, for the most part, appear to be accurate. Using voltmeters and ammeters to calculate the resistance, only one result was anomalous. It can be seen to be anomalous on the graphs above, as it completely deviates the line of best fit from the way it should look, as in the graph plotted with the manufacturer's values. However, the resistance measured with ohmmeters had two anomalous values. Without these, both graphs showing my measurements appear to be almost the same as the the one with the manufacturer's values. By looking at my tables, the resistances calculated with the voltage and current are more accurate when compared to the manufacturer's values than the resistances measured with an ohmmeter. The values measured with the ohmmeter tend to be higher than the other values, but it was already known that the ohmmeter was less accurate than the other method. Removing the anomalous result, the resistances calculated with the voltage and current line up very much in a straight line, but by comparing graphs, the line is slightly steeper than the one with the manufacturer's values, indicating that the manufacturer's given resistances are on average slightly higher than the calculated ones.
The method to calculate resistances with the voltage and current appears to be the most consistent and reliable. Firstly, it only produced one anomalous reading, while the ohmmeter method produced two. Also, when checked in Microsoft Excel, the line of best fit in the graph with the calculated resistances passes through all the points more accurately than the one with the measured resistances.
The ohmmeter measured an anomaly on the wire of diameter 0.71mm. While the same ohmmeter was used, different connecting wires were used for that reading. It could be that these connecting wires were dirty, or damaged, so measured an increased resistance. Both methods recorded the same anomaly with wires of diameter 0.90mm. The resistance recorded is around half of what is shown in the manufacturer's values. This points to a problem with the wire being tested. However, this problem is hard to discover, as the wire was checked to have diameter 0.90mm, and its temperature did not change. It was measured to be one metre long also. The most likely problem is faulty connecting wires again, because there was nothing conceivably wrong with the wire being tested.
There are enough accurate results to be quite sure of my conclusions. Out of the 20 average values taken, only three are not close to the manufacturer's values. That is an 85% success, but it would have been helpful to take readings with more, different diameter wires, but due to time and material constrictions, this was not possible. However, the method I used was not the best possible. If the wire was straightened out along a ruler, human error could result in the crocodile clips being attached slightly wrong, and they are not very thin at the tip, so exactly a meter is very hard to measure out. Therefore, obtaining much thinner crocodile clips would help to make results more accurate. Also, using weights to straighten out the thicker wires would stretch them slightly, giving them slightly lower cross sectional surface areas. To avoid this, it would be necessary to purchase the thicker wires not in coils, but in straight lengths, to give more accurate readings. The measuring instruments used were not the most accurate in existence. However, the most accurate equipment is very expensive, and thus could not be afforded for this investigation.
There are many other variables that could affect the resistance of a wire. Temperature is one, and this could be tested by insulating the wire being tested, and submerging it in water baths of various temperatures while taking readings. Testing wires of different materials would show whether wires of the same length and diameter but of different metals have the same resistance or not. Varying the length of a wire being tested would show whether the length of a wire affects its resistance.