So that the results are as accurate and reliable as possible the readings should be carried out three times and these results would be plotted to draw a line of best fit graph. The average will also be calculated and shown on the graph.
Changes to the method of procedure are as follows:
- A Control will be set up to prove that HCl is the active reactant
- Weigh the marble chips accurately
- Use small marble chips throughout to increase the surface area and speed the reactions up.
-
Make sure the volume of the solution is accurately at 20cm3 throughout.
- After mixing concentration levels of the solution using HCl and Distilled water, use a stirring rod so that the mixture is spread evenly throughout.
- Make sure the marble chips in all the experiments are of similar size so that the surface area does not effect the rate of the reaction
APPARATUS USED
Safety Goggles
Safety Overall
1-hole bung with a delivery tube
1 Gas Syringe
6 Flasks (one for Control)
5 x 20 cm3 of 2M Hydrochloric Acid
5 x 20cm3 0f Distilled water
6 x 0.35g of Calcium Carbonate (one for Control)
1 Stirring Rod
1 Stop clock
A burette stand
A measuring cylinder
METHOD
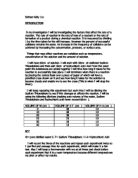
1) Set the apparatus as shown in the diagram
2) Using the balance weigh out six lots of 0.35g of Calcium Carbonate chips
3) Set up the control using a beaker, 0.35g of Calcium Carbonate and 20cm3 of distilled water. Throughout the rest of the experiment check at intervals to see if anything happens.
4) Set up the 5 solutions with different levels of concentration of acid using the burette stand. Remember to stir the solutions.
5) Put 0.35g of the marble chips into each solution and using the clock and gas syringe record the volume of gas released every 30 seconds.
6) Repeat this 3 times and take the average result to make it as fair as possible
7) To make it a fair and accurate test, the concentration of the hydrochloric acid must be the only variable. All the other factors must be kept constant throughout. The volume of the solution must always be 20cm3. The surrounding atmosphere temperature should be kept the same. Windows and doors should be kept shut and the experiment should be kept far away from any Bunsen burners in the room. Also the calcium carbonate chips should be 0.35g every time as well as approximately the same size.
SAFETY: It is very important and the following precautions must be carried out to prevent any accidents:
- Working area must be dry and clean
- Move bags and coats away
- Wear safety goggles and an overall
- Be careful when handling the acid
- Tie hair back
- If possible the experiment should be carried out in a fume cupboard
- Always pour acid to water
SOURCES OF INFORMATION
- Dr. Osei-0wusu
- CGP Chemistry Revision Guide
- “ A Science Dictionary ” by Ron Joyner
ANALYSING EVIDENCE AND DRAWING CONCLUSIONS
From Table 1 it can be seen as predicted that the higher the concentration of hydrochloric acid, the faster the reaction takes place, as more Carbon Dioxide gas is produced. Graph 1 supports this view as the slope for 2M Hydrochloric Acid, the highest concentration of acid, is the steepest slope. Also as the concentration of the acid decreases so does the slope.
Before a chemical reaction takes place the particles need enough activation energy to collide hard enough with each other to bring about bond breaking. To speed up a reaction the particles must collide more vigorously and more often. In a 2M solution of Hydrochloric acid there are more particles of the reactant (HCl) in the solution. As a result there is an increase in the number of collisions with calcium carbonate chips so there is an increase in the number of reactions taking place. The reactions take place faster and so there is an increase in the rate of reaction.
When the concentration of the solution is less, then there are less acid particles for the calcium carbonate to collide with. The same number of collisions will take place as the calcium carbonate will also collide with the water molecules. However the number of successive collisions will be less and so will be the rate of the reaction as a result. This is because the hydrochloric acid is the only active reagent as proved by the control. The control showed that calcium carbonate does not react with water.
The control proved that calcium carbonate does not react with water molecules as no reaction took place. We know this because no carbon dioxide gas was given off and no bubbles were seen. When the concentration of the acid solution was 0.125M, no Carbon Dioxide gas was measured to have been given off. However it is known that a reaction did take place and that some carbon dioxide gas was given off as bubbles were noticed. Carbon Dioxide gas might have not been measured to have given off because the beaker was quite large and only a small amount might have been produced which was not enough to push the syringe plunger. The control proved that the Hydrochloric acid was the active reagent in the reaction
As I am investigating how the concentration of a solution affects the rate of the reaction, I drew Table 2 to calculate the rate of the reaction, as:
Rate = 1 0
Time when 2.25cm3 of gas had been produced
For the time taken, I chose the times when all reactions had produced 2.25cm3 of gas because all of the lines represented different experiments which gave of different volumes of gas. 2.25cm3 was chosen because it was the most amount of gas that the reaction with 0.25M hydrochloric acid (one of smallest concentrations) had produced.
I took the readings for the time taken to produce the 2.25cm3 of gas from Graph 1 as not all reactions produced this exact amount of gas at their 30 second intervals.
Graph 2 shows the rate of reaction for each of the different concentrations of acid. It is clearly visible that the rate of reaction increases as does the concentration of the Hydrochloric acid. This supports my earlier prediction.
CONCLUSION
As the concentration of the solution increases, so does the rate of the reaction taking place. This is because there are more reactant (acid) particles in the higher concentration of Acid. This means that more of the collisions taking place will result in a reaction as calcium carbonate and hydrochloric acid react. The more reactions taking place, the faster the reaction will happen and so there will be a high reaction rate.
This can be seen on Graph 2, as the reaction rate of acid with a concentration of 2M is higher than the reaction rate of the solution with a concentration of 0.5M
EVALUATION
Overall I think that the experiment was carried out at a reasonable standard of accuracy as I was able to draw a precise conclusion from my results. Also most of my results followed a similar pattern.
Looking at Graph 2 it can be seen that there is a reasonably visible pattern between the rate of reaction and the concentration of the acid. This proves that there is a relationship between the two, and that as the concentration of the solution increases, so does the rate of the reaction
Looking at Graph 1, a reasonably accurate looking line of best fit could be drawn through all of the different concentrations of acid, with only a few anomalous results. I had 3 main sets of anomalous results:
- Anomalous 1- 2M HCl (4 in total)
- Anomalous 2- 1M HCl ( 2 in total)
- Anomalous 3- 0.5M HCl (2 in total)
It is noticeable that the higher the concentration of the Hydrochloric acid, the more anomalous results there are. I think this is because in a solution with a high concentration of acid there is a higher rate of reaction and so the volume of gas being given off, is produced quicker. As a result the reading on the syringe changes quickly so it is harder to get an accurate reading for each interval as it keeps on changing. So I think the anomalous results were mainly due to error in reading of the volume of gas given at the intervals.
Also the gas syringe got stuck sometimes and so we were not always able to record the precise volume of gas that had been produced. Looking at the graph one is able to note that nearly all the anomalous readings were below the line of best fit. This tells me that the volume of gas was less than expected and this corresponds with the gas syringe getting stuck a few times in the experiment as the reading of volume of gas would be less that what it should be.
In general however I think that my results were fairly accurate. My method was quite precise as the other factors that effect the rate of a reaction were controlled well. To control surface area the same sized chips were always used and a catalyst was never used in any of the experiments. However I do think that the temperature was not maintained well enough. If repeating the experiment I would ensure that a water bath was used to control the temperature. The failure to control temperature could have been another cause for the anomalous results. During this experiment accurate equipment was also used. A gas syringe was used to measure the volume of gas given off, and a burette was used to measure out the different concentrations of the solutions. Both of these measuring devices have a higher degree of accuracy than for example a measuring cylinder. Other positive aspects of my procedure that were the cause of the accurate results were:
- The experiment was only stopped after three consecutives readings had been taken. This method indicated that no more Carbon Dioxide was being produced and so the experiment was well and truly over.
- A control was set up to prove Hydrochloric acid was the only active reagent.
- The use of the burette to measure the different concentrations of hydrochloric acid ensured the accuracy of the concentration of the solutions.
- A stirring rod was used to stir the mixtures so that the acid particles were evenly spread out
- To save time, which was very limited, small size marble chips were used which increased the surface area. For all experiments the chips were the same size.
All of these factors contributed to a fairly reliable set of results. However there were a few inaccuracies in my method that resulted in the anomalous results. They were:
- Smaller sized flasks could have been used as there would have been less air in the flask to displace and so the readings would have been higher, especially for 0.25M and 0.125M
- More time could have been allocated so that the experiment could be repeated three times. A mean could have been taken from the results and they could have been plotted on the graph. If the experiment was repeated three times the data collected would have been a lot more substantiated as repeating the procedure increases the reliability of the results.
- As the time was limited the calcium carbonate chips could have been grinded into powder. This would have increased the speed of each reaction so they would have ended quicker.
- The readings could have been taken more carefully and with more accuracy at the interval times.
- As mentioned before a water bath could have been used to fairly control the temperature across the experiments ensuring that as a factor that effect the rate of a reaction it would not interfere.
Looking at the graph it is apparent that there were only a few anomalous results and that they did not affect the overall pattern of results, as there were only three sets of anomalies. As a result the conclusion drawn from the graph was not really affected by any inaccurate results as they all appeared to follow a similar pattern.
However the conclusions that I did draw from the data collected were rather unsubstantiated as the experiment was not repeated and so a mean result was not recorded. This was due to a lack of time to repeat the procedure. For my conclusions to be reliable they would have to be based on a wide range of data. An extension of this work could be to repeat the experiment a further two times so that a mean result could be obtained and the anomalies further investigated. A conclusion drawn from that data could be compared to my current conclusions to see how accurate my present interpretations are.
To further investigate the concentration of Hydrochloric acid on the rate of a reaction I could in the following different ways:
- Precipitation
- Change in mass (gas given off)
To further investigate the rates of reactions I could look at experimentally, another factor that effects the rate and compare my findings to this experiment. I think I would look at the surface area of the marble chips. It would provide me with more evidence about changing the rate of a reaction which I could compare to this investigation.
If looking at the surface area I would weigh out 1 gram of calcium carbonate in the following sizes:
- Large marble chips
- Medium marble chips
- Small marble chips
- Very small marble chips
- Powder form
The different sized forms of calcium carbonate would have different surface areas. The 5 different calcium carbonate forms would each be added to 10ml of Hydrochloric Acid and the rate of each of the reactions would be measured by the change in the product’s mass. When using the powder form of calcium carbonate I would have to be particularly careful as the reaction would be big. This would be measured by a gas syringe which would tell me how much gas the reaction gives off. I would use the same concentrations of hydrochloric acid, same temperature and same method as the investigation that I have already conducted. This is so that I can cross-reference how the concentration of the acid and the surface area of the reactant affect the rate of the reaction.