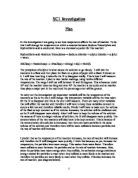
I predict that the 10°C rule will apply to this reaction. This is the theory that, if you decrease the temperature of the reaction by 10°C the rate of reaction will approximately half. Therefore the time for the X to disappear will double. If this theory is true, this is the table of results and graph I expect to get.
To investigate this theory I will plan to collect reliable evidence safely. I will make sure the experiment is safe by wearing safety glasses and wiping up any spillages of solutions.
I will make the experiment fair by keeping the control variables mentioned before, the same. To keep the size of flask the same I will make sure I use the same flask for each reading, washing it out after every experiment. I will keep the concentrations of the reactants the same by using the same source of the solutions. I will keep the volume of solution the same by using the smallest measuring cylinder possible and making sure I avoid parallax error while measuring the solutions out. I will make sure to use 50cm³ of Sodium Thiosulphate and 5cm³ of Hydrochloric acid for all my tests. I will use 0.1M Sodium Thiosulphate and 0.5M Hydrochloric acid. I will also use two different thermometers to measure the temperature of the two different solutions. I will use a 100ml conical flask for the entire experiment.
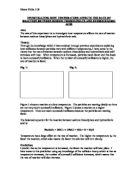
Here is an apparatus diagram of what I will use:
This is how I will carry out the experiment
- Firstly I will measure out 50cm³ of Sodium Thiosulphate in one measuring cylinder, and 5cm³ of Hydrochloric acid in the other.
- I will then draw a black X on a piece of paper, making sure it is smaller then the bottom of the flask.
- I will place the Sodium Thiosulphate in the flask and the Hydrochloric acid in a boiling tube. I will then heat them or cool them down using a water bath and a Bunsen burner and tripod or ice.
- Once they have reached a useful temperature, I will add the solutions together and place the flask on the X. Then I will immediately record the temperature of the solution and start the timer.
- I will time how long it takes for the X to disappear. I will also measure the finishing temperature of the solution to see if there is a temperature change.
- I will repeat this procedure to get 12 temperature values between 10°C and 50°C.
I did a trial experiment to discover what temperature values to use and how to carry out the procedure. Here are my results:
These results told me that I should not exceed 50°C in my actual experiment as , if the 10° rule applied then the time would be 8.5 seconds which is too short. Also I should not go lower then 10°C because if the rule applied then the time would be approximately be 140°C, which is almost too long. This is because if the experiment takes less than ten seconds, reaction time makes a difference to the result, and if I am out in my reactions by 1 second, then that is a 10% error, which is far to large to draw an accurate conclusion. Also if the experiment takes longer than 150s then it is hard to tell when X has fully disappeared and a few seconds out can also create a large percentage error.
Obtaining
Here are the results I obtained:
I did not make any changes to my plan while doing the experiment. I collected an even number of results from all areas of the range I was working in. I did not collect more results from a certain area of the range as I wanted to make my graph look more accurate and for my conclusion to be more accurate.
Analysis
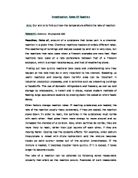
My results show me that, as the starting temperature increased, the time taken for the X to disappear decreased. They also showed me that as the temperature increased, the rate of reaction also increased. This is because, as you increase the temperature, the particles have more energy. This makes them move faster. Therefore more collisions occur between the particles and so the rate of reaction increases. Also, since the particles have more energy when they collide, the activation energy (minimum energy needed for particles to react when they collide) is more likely to be reached and therefore the particles are more likely to react when they collide. This means that the precipitate of sulphur is produced more quickly in the reaction, and therefore the solution goes cloudy more quickly and so the X disappears more quickly. This explains the pattern shown on my graph.
As can be seen from my graph for temperature against time for X to disappear, the results turned out to be a curve. The curve went from the top left of the graph to the bottom right. This means that the time for the X to disappear was not proportional to the temperature of the solution when the reaction occurred. There was a larger time gap between the points on my graph when the temperature was less than when the temperature was greater. I think this was because when the temperature increases, the trend line flattens out and this is because the reaction takes a certain amount of time to take place and so there is a certain time that is needed for the reaction to occur and the sulphur precipitate to be formed. Also, since the readings resulted in a curve, then two factors must be affecting the results.
I will test to see if the 10ºC rule is proved or disproved by my results. This is a table of some readings taken from my graph at random.
To prove that the 10°C theory was true, the ratio for all my readings would have had to be 0.5, and as you can clearly see, all the readings turned out to be slightly above this value. However they are all close to this value and so the theory could be true and my trend line could be a bit wrong instead. However this does show that my prediction was slightly off as I predicted that the results would follow the 10ºC rule. Although, I think my prediction was accurate as I said that I thought that with a rise in temperature, the time taken for the X to disappear would decrease and the rate of the reaction would increase and as my graphs show, this turned out to be right.
I did a second graph to show the rate of reaction against the temperature and this graph turned out to be not proportional as the trend line was a curve that went from the bottom left to the top right. This shows that the rate was not proportional and this means some other factor affected this. The graph shows that the change in rate was greater at higher temperatures. For instance a change from 40 to 45°C caused a change in rate of 0.025, whereas a change from 15°C to 20°C caused a change in rate of only 0.004. This is because the rate for the higher temperatures is greater and so even though this difference looks large, percentage wise it is less so.
Evaluation
Overall I think the experiment I carried out was conducted safely, efficiently and accurately. Therefore I believe that my results were accurate and therefore my conclusion was a reliable one. My results were precise as they all fitted neatly onto the graph and were all either on or near the trend line. I think I obtained a good number and a good range of results as they allowed me to draw an accurate conclusion.
On my graph for temperature against time for X to disappear I found that I did not get any real anomalies, apart from some which were not as close to the trend line as others, such as the 41, 31 and 35ºC measurements. These could have been slightly out due to a fault in the experiment, such as the solution was not stirred as much during the reaction or reaction time for stopping the clock may have played a part.
For my graph for rate of reaction against temperature there were again no real anomalies, however the values for 31, 35 and 47°C were a bit further from the trend line than others. Again this was probably due to an error in the experiment.
I think that my final conclusion was an accurate one, even though it did not fit exactly with my prediction. I think this because I conducted the experiment carefully, and nearly all my results fitted neatly onto the trend line on the graph. Also the pattern that is shown makes sense using scientific theory.
If I were to carry out this experiment again, I would probably do more readings for the values of temperature. I could also try higher temperatures of solution and just really try to make sure reaction time was good enough. I would also try to improve the accuracy of the procedure by more thoroughly washing the apparatus after each experiment as some chemicals may have been left in the flasks and may have affected the results.
If I were to do further experiments to see if the 10°C rule applied, I would probably use different concentrations and see if the 10° rule applied with that. To do this I would use a different concentration for the two reactants used, and use a similar range of temperatures to ascertain whether or not the theory applies. I would predict from my results that the outcome will be no different with a larger concentration or a smaller concentration.