Investigating How the Concentration of Sodium Thiosulphate Affects the Rate of Reaction, Between Sodium Thiosulphate and Hydrochloric Acid
Investigating How the Concentration of Sodium Thiosulphate Affects the Rate of Reaction, Between Sodium Thiosulphate and Hydrochloric Acid
Background
We had been experimenting with sodium thiosulphate and hydrochloric acid. We found that when we added hydrochloric acid to sodium thiosulphate it went cloudy, and eventually opaque.
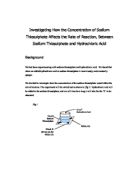
We decided to investigate how the concentration of the sodium thiosulphate would affect the rate of reaction. The experiment will be carried out as shown in 'fig 1', hydrochloric acid will be added to the sodium thiosulphate, and we will time how long it will take for the 'X' to be obscured.
Fig 1
Planning
Safety
We must follow certain safety guidelines to avoid injury to ourselves or others; these safety measures are listed below:
* Goggles must be worn, as hydrochloric acid is caustic and could cause damage to eyes.
* Make sure all bags, stools etc are out of the way, so as not to be tripped over.
* Remove blazer and tuck in ties or any other loose ends
* All spillages must be reported to the teacher immediately.
Variables
Independent Variable
The independent variable is the concentration of the sodium thiosulphate. We will vary the concentration of sodium thiosulphate from 80g/dm3 to 5g/dm3. We hope to see a trend of change in the reaction time as the concentration is changed.
Dependant Variable
The dependant variable is the time taken for the 'X' to be obscured; every time the 'X' is obscured, the same amount of sulphur is released.
Control Variables
The aspects we will keep constant are:
I. Temperature.
II. Pressure.
III. Concentration of hydrochloric acid; any change will affect the rate of reaction.
IV. Volume of hydrochloric acid; will also affect the rate of reaction.
V. Overall reactant volume.
VI. Beaker - as the cross section is changed, the thickness of the liquid will change.
VII. The position from which we will look into the beaker.
VIII. The same person must take the reading; as different people will judge differently when the 'X' has disappeared.
IX. The 'X' must be the same colour and thickness; any change in the 'X' will change its visibility.
X. The batch of sodium thiosulphate.
XI. The lighting in the lab.
Prediction
Hypothesis
'I predict that as the concentration of sodium thiosulphate is increased, the time taken for the 'X' to become obscured will decrease, thus the rate of reaction has increased.'
Theoretical Explanation
When the 'X' disappears, there has been a certain amount of sulphur (S8) produced by the reaction, as this is what turns the solution opaque.
If it takes longer for the 'X' to disappear, then the reaction is obviously slower i.e. it has taken longer for the Sulphur to be produced.
The 'Collision Theory' supports this reasoning. It states that if there are more particles of a fixed amount of substance i.e. a higher concentration, the particles are more likely to collide with each other than they would be in a less concentrated ...
This is a preview of the whole essay
Theoretical Explanation
When the 'X' disappears, there has been a certain amount of sulphur (S8) produced by the reaction, as this is what turns the solution opaque.
If it takes longer for the 'X' to disappear, then the reaction is obviously slower i.e. it has taken longer for the Sulphur to be produced.
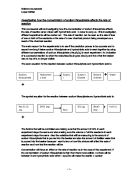
The 'Collision Theory' supports this reasoning. It states that if there are more particles of a fixed amount of substance i.e. a higher concentration, the particles are more likely to collide with each other than they would be in a less concentrated (more dilute) solution. The diagram below, fig. 2, illustrates this:
Fig 2
In fig. 2, the first box contains the less concentrated solution, there are less particles of Sodium Thiosulphate, to collide and react with the particles of Hydrochloric Acid. In the second box, there are more particles, so the chance of collision is increased.
Since, when the 'X' disappears, a certain amount of Sulphur (S8) has been produced, this means that if the 'X' takes longer to disappear, the reaction is slower. This statement hints at proportionality; therefore, we can use the formula below to display the point:
R = rate of reaction ? = certain amount of sulphur
Experimental Procedure
Apparatus
The apparatus we will use is in this investigation is listed below:
* Conical Flask
* Sheet of Paper with large letter 'X' written on it
* Graduated Cylinder
* Stopwatch
* Sodium Thiosulphate
* Hydrochloric Acid
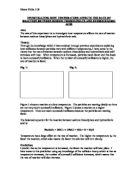
The assembled apparatus is shown in fig. 3 on the following page.
Fig 3. The Apparatus.
Method
* Firstly, we will measure out 50cm3 of 80g/dm3 concentration Sodium Thiosulphate (Na2S2O3) and will pour it into one of the conical flasks, and place it over the sheet of paper with the X on it.
* We will then add 10cm3 of Hydrochloric Acid (HCl) to it, and time how long it takes for the X to become obscured while looking down at it through the solution. When this occurs, it means that the required amount of Sulphur (S8) has been produced.
* This will be repeated to increase accuracy.
* The above three steps will be repeated for each of the concentrations of sodium thiosulphate, see tab 1 on the next page. In order to make the sodium thiosulphate more dilute, measured amounts of water will be added to it, the exact quantities to mix are also given in tab 1.
* For smaller volumes of Sodium Thiosulphate, we will double the amount measured out. So, instead of 50cm3 of Sodium Thiosulphate and water solution being measured, 100cm3 will be measured out.
Fair Testing
Most of the fair testing for this experiment is mentioned in the variables section, under controlled variables. As these will not be altered in any way throughout the experiment, this ensures a fair test every time we perform the experiment for different concentrations of Sodium Thiosulphate.
Also, I will take two readings for each concentration of Sodium Thiosulphate, and will then take the average of each. This will ensure accurate results.
Results
Range of Readings
We performed a preliminary experiment, in order to decide upon a realistic range of results. On below (tab 1) is a table showing the range of readings we will use during the experiments.
Tab 1
Concentration of Na2S2O3
Volume of Na2S2O3
Volume of H2O
Volume of HCl
(g/dm3)
(cm3)
(cm3)
(cm3)
80
50.000
0.000
0
40
25.000
25.000
0
20
2.500
37.500
0
0
6.250
43.750
0
5
3.125
46.875
0
Repeat Readings
As I have already mentioned, to ensure accurate results, I will take two separate readings for each concentration of Sodium Thiosulphate, and then, I will find the mean.
If the two readings vary by a substantial amount of time, I will take a third reading and then drop the most inaccurate result, and calculate the average of the other two.
Processing Results
Below, is a blank table tab. 2, which I will record my results on?
Tab 2
Concentration of Sodium Thiosulphate (g/dm3)
Time 1
(s)
Time 2
(s)
80
40
20
0
5
Tab 3
Concentration of Sodium Thiosulphate (g/dm3)
Average Time (s)
/ Time
80
40
20
0
5
Tab 3 will contain my processed results.
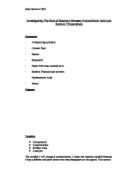
I will also plot a scatter graph with a best - fit line of the concentrations of the Sodium Thiosulphate against the average times for the X to 'disappear'. Below, in fig. 4, is an example of what the graph may look like. All results are purely hypothetical.
Fig. 4
Obtaining Evidence
Concentration of Sodium Thiosulphate (g/dm3)
Time 1
(s)
Time 2
(s)
80
580
550
40
195
198
20
70
61
0
39
35
5
20
8
Concentration of Sodium Thiosulphate (g/dm3)
Average Time (s)
/ Time
80
565.0
40
196.5
20
65.5
0
36.6
5
19.0
Graphs
On the next two pages are my two graphs, drawn on a computer on Microsoft Excel.
Interpretation
Result Processing
Under the title 'Obtaining Evidence', the table, 'tab 3', which contains my raw data, is given. From this data, the average time taken for the 'X' to disappear in each concentration of Sodium Thiosulphate was calculated.
I also drew two graphs, which give a visual representation of the results:
* Concentrations of sodium thiosulphate against average time for the X to disappear. This graph shows that as the concentration increased the time decreased.
* Concentration of sodium thiosulphate against the reciprocal of the average time for the X to disappear. This graph is proving the formula I stated in my theoretical explanation, 'rate of reaction is proportional to the reciprocal of time'.
Conclusion
I can now draw the conclusion, that the time taken for the 'X' to be obscured decreases as the concentration of the Sodium Thiosulphate increases. This means that, the rate of the reaction increases as the concentration of the sodium thiosulphate increases.
If the rate of the reaction increases with the concentration, and the time decreases with the concentration; we can deduce that the rate of the reaction is proportional to the reciprocal of the time taken for the X to disappear:
Hypothesis and Results
My hypothesis was 'I predict that as the concentration of sodium thiosulphate is increased, the time taken for the 'X' to become obscured will decrease, thus the rate of reaction has increased.'
From my result table and from graph 1, I can see that the results confirm my hypothesis. The points follow a negative curved shape; this shows that in fact, time taken for the 'X' to disappear does decrease as the concentration of the sodium thiosulphate increases.
Theoretical Explanation of Conclusion
The reason that the rate of reaction increases as the concentration increases, is because as the concentration increases, there is more of a chance of the particles of the Sodium Thiosulphate and the Hydrochloric Acid colliding.
This is known as the 'Collision Theory': It states that if there are more particles of a fixed amount of substance i.e. a higher concentration, the particles are more likely to collide with each other than they would be in a more dilute (less concentrated) solution. See fig. 5.
Fig. 5
In fig. 5, the first box contains the less concentrated solution, there are less particles of Sodium Thiosulphate, to collide and react with the particles of Hydrochloric Acid. In the second box, there are more particles, so the chance of collision is increased.
Anomalous and Inaccurate Results
On graph 1, all the results appear to be quite close or on the best-fit line, so there are no real anomalous or inaccurate results.
On graph 2, the point corresponding to a sodium thiosulphate concentration of 20g/dm3, appears to be some way away from the trendline. This was due to some form of human error, possibly the time was recorded badly, or the quantities and concentrations in the experiment were not wholly correct. All the other results are reasonably close to the trendline.
I have however deduced that graph 2 is very accurate, as the trendline touches the x-axis very close to the origin. We can use this distance from the origin to measure accuracy, because the reciprocal of infinite has to be 0; therefore the closer the trendline is to the origin when it cuts the x-axis, the more accurate the graph is.
Future Improvements
Experimental Procedure
During the experiment, we found it extremely difficult to measure the small volumes of the liquids. This meant that the measurements were not entirely accurate, which meant that the final results were not flawless either.
To improve the experiment, we could have used, for example a syringe, or other more sophisticated apparatus to measure the tiny volumes. Another improvement, which could be made, is the use of opto-electronic systems to measure when the solution becomes opaque, for example, an optoswitch could be used. As the switch would never change, then the stage it detects that the water is opaque will be the same for all of the experiments, eliminating human error.
Execution of Experimental Procedure
Although the equipment we had to work with was somewhat basic, the experiment was successful, giving the expected outcomes, and reasonable correlation on the graphs. We always made up much more of the solution than required, so that we did not have to measure out tiny quantities of water and sodium thiosulphate, this improved the reliability of the experiment, although the very small quantities were still difficult to measure. I expected to see a much less accurate graph, and I was very pleased that there was only one anomaly.