Diagram Showing Collision Theory
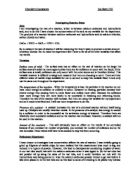
Diagram: (Main Experiment) (Measuring Equipment)
Preliminary Work: To decide on the values of variables to keep the same we carried out preliminary experiments. The first preliminary experiment we carried out was to find the mass of chips to use and this experiment was used to test the range of concentration to use in the experiment. These experiments were important to carry out because we could make sure the reaction did not fill up the cylinder too quickly leaving many times blank as the cylinder cannot contain all of the gas. This could also make sure the reaction did not take place too slowly to give us a small range of results such as if we had used 1.0g of CaCO3 with 5cm3 of HCl the acid had to be in excess of the other reactant (CaCO3)
To carry out the experiment we used the equipment above, a gas syringe and timed how long it took for the syringe to be filled up to 100cm3 of C02. We reacted both of the reactants HCl and CaCO3 in a conical flask just like in the main experiment. From this we decided the best mass to use was 0.5 grams this was because this reaction took place at a reasonable rate because it was fast enough to get a wide range of results but anything faster would make the experiment hard to record as the cylinder would be filled too quickly such as using 7.5g of CaCO3. So I found the best combination to use was 0.5g of CaCO3 and 25cm3 of HCl for my main experiment as this gave the best range of results.
Method: Firstly lay out all the equipment shown above.
- Weigh out accurately 0.5g of Calcium Carbonate making sure the chips are of equivalent size (small chips) using high sensitivity digital scales.
-
Then set up the apparatus as shown in the diagram above taking care that all fittings are air tight so that there can be no leakage of CO2. Check the delivery tube for any cracks or holes, which may allow air through. In addition, before starting check that the gas syringe is showing zero on the scale.
- Then carefully make a paper funnel and slide the chips into the conical flask taking care not to bump them unnecessarily breaking them down into smaller pieces giving them a larger surface area.
-
Then take a burette as shown in the diagram (after flushing out with distilled water) and fill up with 100cm3 of Hydrochloric Acid.
-
Then very carefully measure out 25 cm3 of Hydrochloric Acid into a conical flask, taking care to read off the scale of the burette from the meniscus to ensure accuracy.
-
Have a stop watch at hand; then pour the contents of the conical flask into the flask with the Calcium Carbonate and immediately start the stop watch, at the same time replace the bung firmly into the top of the flask, to stop any CO2 leaking out apart from going in the gas syringe.
-
Then every twenty seconds note down the amount of C02 produced by reading off the scale on the gas syringe, do this until the reaction is exhausted, stopping at the end of the gas syringe. Repeat these instructions three times in order to attain an average at each concentration, which can then be interpreted into a graph.
Fair Test: In order to make the experiment fair I must make sure that some things are controlled and others varied. The only thing that will be varying in this experiment is the molarity of the acid, however to attain a high level of accuracy I must make sure that the measuring of the HCl is very accurate. I also must make sure that if I am making up any solutions of acid i.e. to get the 1.5M strength of acid or the 0.5M that the ratio of distilled water to acid is the same each time, as this would affect the molarity of the acid, which would show as an inaccuracy in our results.
I will also be controlling some things to the best of my ability such as the temperature of the acid, I will make sure that it is around room temperature so that this doesn’t have any effect on the rate of reaction giving us anomalous results. I will also store any acid waiting to put into the reaction away from windows, which might change the temperature of the acid; therefore I will keep the acid in a draught proof area. I will also try and control the size of the chips of Calcium Carbonate so that there is not too much difference in size which would then give the chip a larger surface area allowing the acid to react with it faster, which would then detract from the main aim of the experiment. I will use the same measuring and gas collection equipment for each time I carry out the experiment, which would then rule out the possibility that one piece of equipment, was more accurate than another. There are sometimes differences between equipment such as the length of the delivery tube and the type of weighing scales, which can make a difference. I will make sure that I time the experiment with up most accuracy, by immediately starting the stopwatch as the HCl enters in with the CaCO3 which is when the products are starting to be produced and finish when the reaction stops. I will always have another person timing whilst I put the reactants together so there is no time lapse also whilst the reaction is proceeding I will make sure that on every 20 seconds the reading of C02 produced is taken. In addressing all these factors there should be a minimal chance that there should be any inaccuracies whilst conducting the experiment.
Safety:
- Wear safety goggles because we are dealing with an acid Tuck stools in to make sure no-one falls in the lab
- Put all bags under the table to make sure no-one falls
- Never run in the lab
- Always stand up when carrying out experiments so we can move away if we are in any danger
Analysis: From looking at my graph I am able to ascertain that as the molarity of the acid increases, the rate of reaction also increases in a proportionate way. From looking at the gradient of the 2.0M, I can clearly see that it is much steeper than that of the 1.0M, as the molarity of the acid increases the gradient gets steeper. I am able to see that the 2.0M produced much more C02 in 20 seconds than the 1.0M in the same time. This is also comparative with the 0.5M compared with the 0.1M.
I have more scientific theory to reinforce what I have come to find out and the reason for it doing so. The Reaction Rate is often called the Collision Theory, which describes the way; concentration of the liquid reactant (being HCl) affects the rate of reaction, on the solid reactant (being CaC03) by affecting the amount of collisions from H+ particles coming into contact successfully with the CaC03. Particles react when they collide with sufficient energy, which pertains that it has sufficient activation energy (EA ) to start a reaction, which involves the breakdown of the bonds between the two reactants to form the products. I have produced an energy profile diagram to illustrate using the bond values how much activation energy is needed before the bonds are broken. It is at this point to when the products are formed that the collision theory really is seen in order to attain the products being made.
I have calculated that it would need a minimum of –1652KJ/Mol of activation energy (EA) for the reaction to take place anything below this would result in failure of a reaction. Due to the fact that this is an exothermic reaction heat is given out (thermal energy), this would also have the effect of increasing the reaction as regards to giving the H+ ions more kinetic energy with the increase in temperature of the HCl giving the particles thermal energy. There will be more collisions between the reactants because of more thermal energy in the H+ ions, which are still in the solution, which will be heated due to other particles reacting with the CaC03 meaning that these particle will have more kinetic energy resulting in more energetic collisions. The higher the temperature of the HCl means higher velocities of the H+ ions particles. This means there will be less time between collisions. The frequency of collisions will increase. The increased number of collisions and the greater violence of collisions would result in more effective collisions, resulting in an overall faster reaction.
At a higher concentration, collisions are again more frequent, as there are more reactant particles in the liquid. The reaction rate, or velocity, at which a chemical reaction proceeds, is expressed in terms of the amount of a product formed C02 per unit time. Thus, for the reaction of two compounds X (being HCl) and Y (being CaC03) that forms products Z or more (being H20, CO2 and CaCl2). The equation is X + Y= Z, and the reaction rate may be given by the rate of increase of the concentration by X.
Mathematically, the reaction rate is given by dCZ/dt, -dCX/dt, or -dCY/dt, in which C represents the concentration (e.g. molarity) of the species denoted by the subscript. The symbol d/dt is the mathematical expression for the rate of change of some quantity with respect to time (being CaC03). Chemical reactions proceed at different speeds depending on the nature of the reacting substances and the type of chemical transformation in products being created. In general, reactions in which ions (electrically charged particles) combine or separate occur very rapidly such as the H+ ions, while those in which covalent bonds are formed or broken are much slower such as the H20. For a given set of reactants, the speed of the reaction will vary with the concentration or pressure imposed on the reacting system and the amounts of reactants used. Ordinarily the reaction will gradually slow down as the reactants become depleted and as more products are produced hampering the reaction such as the H20 and CaCl2. The reaction-rate constant, or the specific rate constant, is the proportionality constant in the equation that describes the relationship between the rate of a chemical reaction and the concentrations of the reacting substances.
If r represents reaction rate, k is the symbol customarily used for the reaction-rate constant, and f(C) is an expression for the concentrations of the reactants, then the equation for these values is r = kf(C). If the reaction rate, or velocity, is visualized as being determined by two factors, one representing the amount of molecules present and the other the type and the condition of those molecules, then the rate constant is a quantity that represents the latter. The prediction, measurement, and interpretation of reaction rates are subjects of the branch of chemistry known as chemical kinetics and how temperature effects on rates of reaction, Kinetic theory say that molecules are in constant motion. The kinetic energy and molecule velocity increase with temperature and concentration. KE = [1/2][mv2] Reactions usually require collisions between reactant molecules or atoms. The formation of bonds requires atoms to come close to one another (being HCl and CaC03). New bonds (being H20, CO2 and CaCl2) can form only if the atoms are close enough together to share electrons. Some collisions are not successful. These are called ineffective collisions. The particles simply hit and then rebound. Collisions that lead to products being produced are called effective collisions. An effective collision must happen with a great enough speed, energy and force to break bonds in the colliding molecules. The three product molecules (being H20, CO2 and CaCl2) formed fly outwards. Collisions between molecules will be more likely to happen with a higher concentration. The higher the concentration means higher frequency of collisions in a given time. This means there will be less time between collisions. The increased number of collisions results in more effective collisions. The rate for the reaction increases if the concentration of reactants is raised; the results I managed to obtain further enforce this theory.
From looking at my graph displaying the averages at each concentration
I am able to see that the 2.0M produced the most CO2 over the period of 360 seconds, however looking at a specific point in the graph such as the amount produced in the first 20 seconds, I am able to calculate the rate of reaction by the simple calculation Y/X= cm3/s of CO2 produced. The 2.0M concentrations produced 12 cm3/s of CO2 whilst this contrasted with the 0.5 that produced 3 cm3/s of CO2. This would mean that the 2.0M produced 9 cm3/s of CO2 more in the given time, which is about right as it is quarter the strength of the 2.0M. The 1.0M strength produced exactly half that which the 2.0M did, however the 1.5M only produced 5 cm3/s of CO2 which doesn’t really follow the trend however this could be due to the experiments being conducted on a colder day which would decrease the temperature of the acid. The 0.1M didn’t manage to produce any CO2 in that time, this could be due to insufficient pressure which it needed to push the gas syringe out, simply because the acid was too dilute meaning only a small reaction was taking place, for much CO2 to be produced. I also noticed that although there was the same amount of reactants there wasn’t the same amount of products formed, this could be due to a number of things. The distribution of H+ particles in the acid may have changed from one day to the next, which would mean an unequal distribution. This would affect the rate of reaction and the amount of products produced, by increasing or reducing the amount of CO2 formed. This then disproves my theory at the start that they would all produce the same amount of CO2, and that the amount produced at each concentration would be uniform, however this is as shown by my results is not possible. The exact relationship between reaction rate and concentration depends on the reaction "mechanism". This is the process involving elementary reaction steps. The slowest step controls the rate. The nature of the slow step is not obvious from the balanced equation shown on following page. Only my experimental observation reveals the link between concentration and reaction rates, which pertain to the fact that as concentration is increased, the reaction increases in a proportionate way but not always directly proportionate each time.
Evaluation: When I initially thought about conducting the experiment the method I thought to use (Displacement Method) was a little different from the one I ended up using due to various limitations (see diagram) with the set up and the equipment used.
However after experimenting with this set up and finding that it had many limitations we substituted some of the equipment for more accurately collaborated pieces which enabled us to get the results obtained. Instead of using an upturned measuring cylinder, I changed this for a gas syringe, which is a precision piece of equipment for gas collection unlike the measuring tube it will always give an accurate reading as its scale starts at the very bottom of the syringe so that every bit of gas that enters, is accounted for. The measuring cylinder doesn’t have a scale as accurate as this and neither does it start for the bottom, which would pertain that some gas may have entered the cylinder but you were unable to read off the scale as to what it was. I also made sure that I used the same delivery tube each time to eliminate the chance that some of the CO2 may condense in the pipe, this was so that all of the gas went into the gas syringe. After each experiment, I marked up the tube so that the same one was used for each of the experiments, I wanted to do this as not all the tubes were the same length, and some had perforations in them allowing the gas to escape. I didn’t want to use a different one each time as this would have customised the reliability of our results. So using these pieces of equipment I have tried to attain the highest level of reliability.
After obtaining the results and plotting them on a graph one of the first things I noticed was that the differing strengths failed to reach the same end point by producing 100cm3 of CO2 this came as a surprise as I tried to keep all factors the same.
However looking closer at the varying things I understand why, it could be due to the culmination of a number of factors. The small CaC03 chips that I used were sorted into jars of equivalent size however this wasn’t accurate enough as they all had different surface areas and depending whether it was an old jar, which was nearly finished, or a new one. The latter tended to have more equally sized chips, whilst the old jars; the chips at the bottom had been reduced to a powder. This was quite a consideration, as a powdered granule of CaC03 would have a substantially larger surface area than a chip of equivalent mass, sometimes we were unable to get chips which were always the same size. Therefore, in the experiment the chips of a smaller size and a grater number of them had the advantage over larger and fewer chips, which took longer as the acid had a smaller surface to attack this we controlled to the best of our ability.
Also the temperature of the acid fluctuated from one test to the next by a degree or two, which would have made a slight difference as the H+ ions would be moving with more kinetic energy, than those in the acid which was 20C colder. We recorded the temperature at the start of each test and it does waiver slightly looking back. This could have due to the acid being left in a cold place overnight, wherefore the temperature would decrease for when we came to use the acid for another range of tests. This factor was uncontrollable as getting the acid to a prefixed temperature involved some degree of heating, which is excluded in this experiment. Another thing, which usually isn’t noticed, is that the distribution of H+ ions may have been different in the same concentrations of acid, which would have also had the effect of increasing or decreasing the reaction in that with more particles present even though it is the same concentration, the particle count is different. One day there might be 1300 particles another day there might be 1500, that extra 200 would make quite a difference. This is something however that is out of our hands, no matter how accurately you measure, the distribution of H+ ions will always vary, this is another factor which is uncontrollable.
These were the things, which were probably responsible for giving us an anomalous result with the 1.5M strength solution, which I have ringed in red on the graph but I think predominantly the main reason was the chip size in this instance. The chips we were using on the day of conducting the range of experiments at this concentration were of a smaller size than previously used, and as afore mentioned this does have a difference. With a smaller chip size there tended to be a ‘jumping’ in the gas syringe, and as result there was one significantly lower than the rest 38 whilst the other two readings where 45 and 46 cm3 respectively. This in turn brought the average down for this reading however, the base of the problem lies with the chip size.
We tried to control things to the best of our ability such as the measuring of the solutions, which had to be made up such as the 1.5M and 0.5M. To reach a high level of accuracy for measuring the various strengths of HCl out we used a burette. This is also a precision piece of equipment, which we used measuring from the meniscus to ensure that the ratio of acid to distilled water was accurate along with the exact amount to be used in conjunction with the CaC03 in the conical flask. We also used a set of high sensitivity scales using the same type each time, which gave a reading to 1.dp when we measured out the CaC03. We always made sure that we measured out exactly 1.0g each time so that there wasn’t any element of error in this part of the experiment and to use the equipment to its potential to gain attain a high level of accuracy.
There are a few ways, which we could have improved the procedure in order to make the measurements we have already gained even more reliable. One of the ways would be to make the chips of CaC03 into tablet form, which would then allow each set of reactants to have the same surface area and there wouldn’t be any thought that there was an unfair advantage due to a larger surface area. We found when conducting our experiment that the chip size range was quite big, and consequently the surface area differed, and this played on our results. It didn’t matter too much as it was all relative however we would see the difference if the CaC03 was processed into tablet form. Another way in which to improve it would be to used a scientific glass and thread as shown below. The use of this piece of equipment would minimise gas escaping when placing the bung on after the CaC03 has been poured into the measuring flask. This initial part of the reaction is when most the most CO2 is being produced and so it is crucial that as much as possible can be contained. It works by the CaC03 being placed in the glass and for the glass to be inserted hanging by the thread into the conical flask allowing it o float in the HCl. The thread is draped over the top of the flask and the bung is placed in. When the reaction is ready to start, it is just the case of pulling the thread, which tips the CaC03 in the glass into flask allowing the reaction to start, and without losing any CO2 making the gas collection highly accurate, as none is lost in the initial stages of the reaction.
This also allows the CaC03 to be added to the HCl, which is the best way; this is because if the HCl were added first there would be a time delay before all of the HCl was in the flask. In adding the CaC03 to the HCl, it is quicker and also all of the acid is present to start reacting on it straight away when the CaC03 first is exposed to it.
There is also another possible way to monitor the rate of reaction, that is to weigh the flask, and contents before and after the reaction had taken place. This should make manifest a relation ship between the amounts of CO2 produced and the decrease in mass of the contents of the flask. As more CO2 is produced i.e. with a stronger acid then overall mass of the flask should decrease from start to end mass as CO2 as a product has been lost which would make the flask lighter. This would be an alternate way to see that a higher Molarity acid lost more mass in a given time than an acid of a weaker molarity (M).
If I were to conduct the experiment, again I would make sure of some factors in order to establish a firmer conclusion. I would tablet all CaC03 used in order to ensure that there was equal surface area. I would use a data logger to prompt me for timing to take gas readings. I would use a PH meter to test the acidity of the HCl in order that I could get the different samples at each concentration as near to each other as possible in order that there was a minimal chance of an advantage due to higher acidity. I could also use the PH meter also along with the data logger to see how long it took before the contents of the flask was neutralised as it is a neutralisation reaction. A faster reaction would mean faster neutralisation. I could also after the reaction is exhausted heat the flask and contents being CaCl2 to see how production of gas differs with production of CaCl2, as CO2 production increases so does CaCl2 production.
These are further ways I could use to reinforce and form a concrete conclusion after what I have already found out, whilst looking at the reaction from different angles and analysing parts I haven’t already done so in order to clarify ideas on further reactions.