To ensure that my experiment is safe I will use a resistor to control the voltage through the circuit and will limit the current through the circuit 0.50 amps. I will keep the table’s surface and my hands free of water or any other conductive substance.
Variable:
I will be varying the cross-sectional area of a resistor to see how its resistance is affected. The resistor in this experiment will be a length of nichrome wire.
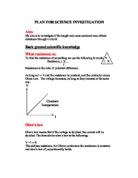
Diagram:
Apparatus:
Item: Amount:
Nichrome wire SWG 24 1 meter
Nichrome wire SWG 26 1 meter
Nichrome wire SWG 28 1 meter
Nichrome wire SWG 30 1 meter
Nichrome wire SWG 32 1 meter
Nichrome wire SWG 34 1 meter
Ammeter x 1
Voltmeter x 1
Crocodile clips with wire x 6
Power unit x 1
Variable rheostat x 1
Results 1:
Wire Current: amps Voltage: volts Resistance: ohms
Yellow 0.50 1.39 2.78
Green 0.50 3.38 6.76
Blue 0.50 4.84 9.68
Red 0.50 6.68 13.36
White 0.50 9.06 18.12
Orange 0.44 11.15 22.30
Results 2:
Wire Current: amps Voltage: volts Resistance: ohms
Yellow 0.66 1.28 1.94
Green 0.94 6.08 6.47
Blue 0.75 7.34 9.79
Red 0.67 8.76 13.07
White 0.51 9.40 18.43
Orange 0.40 9.98 24.95
Conversion Chart:
SWG Thickness: mm. Area: mm² Code
24 0.559 (0.56) 0.245 Yellow
26 0.457 (0.46) 0.164 Green
28 0.376 (0.38) 0.111 Blue
30 0.315 (0.32) 0.078 Red
32 0.274 (0.27) 0.059 White
34 0.234 (0.23) 0.043 Orange
Conclusion:
I opted to use six different wires that all differ in cross sectional area. A code is used to express the dimensions of the wires. The dimensions of the wires are measured using a micrometer screw gauge and the dimensions are expressed by a two digit number. This measurement code is shortened to SWG. I have used wires with SWG values of 24, 26, 28, 30, 32, and 34. I believe that this gave me a good variable range of six different sizes. The exact measurements of a piece of wire with the above SWG values are shown in the conversion chart above.
From looking at my results it is evident that there is a relationship between the cross-sectional area of the wire and its resistance. As the cross-sectional area of the wire increases the wires resistance decreases. A relationship between the voltage across the wire and the resistance of the wire can also be seen. As the potential difference across the wire increases the resistance increases. This is because a higher voltage is required to counteract the resistance of the wire which can be an indicator of an increase or decrease in resistance.
I have concluded that as the cross sectional area or a resistor increases the resistance that it has will decrease. This complies with my prediction. This conclusion is shown clearly in my results and is reproved in my second set of results. I believe that the results obtained from my experiment support my conclusion
I have found from my experiment that resistance is dependant on cross-sectional area and that cross sectional area can have a big impact on the resistance of a piece of wire. I have also proved that my prediction is correct. As I predict the resistance is decreased as the cross-sectional area of the wire is increased. I believe that the reasoning behind my prediction is correct. I have proved that if there are more free electrons available to carry a charge through a substance, the resistance of that substance will decrease making it a better conductor.
I have carried out two experiments which both brought me to the same conclusion. I believe that some results that I obtained could have been influenced by anomalous factors which were beyond my control, but still proved my theory. I believe that if this experiment were carried out again in similar conditions, it would produce similar results that would draw to the same conclusion.
Evaluation:
I believe that this experiment was an overall success. My results fulfilled my aim and complied with the prediction I made and the background theory that I had assembled. The results supported my prediction because the background reasoning I used to produce the prediction specifically explained the behaviour of the flow of electrons which would be affected by resistance.
I carried out two identical experiments in almost identical conditions but the results from the two experiments differed slightly. Although there was a difference between the two sets of results the difference was small enough to write off as an uncontrollable environmental variation or a variation between the apparatus used.
My results for both experiments were quite close which proves that my experiments were fair. I complied with all the regulations I set for this experiment which would make the experiments fair under ideal circumstances. The results that I produced are reliable and I believe them to be easily reproduced.
I did notice that the wire SWG 34 produced anomalous results. I believe this to be down to its small surface area which makes it quite fragile. This makes them easily damageable which affects the surface area. If I were to repeat the experiment I would perhaps exclude wires with including or smaller that SWG 34. I believe that the variables used in this experiment produced reliable results and I would use the same variables if I were to attempt this experiment again.
If I were to extend this experiment I would perhaps experiment on how other factors influence resistance such as temperature or length. If I were to extend this experiment using the same variables I would test out more types of wire with different SWG values and wires made of different materials such as copper. If I had more time to carry out the experiment I would use a wider range of wires and would vary the current passed through the resistor.