Plan:
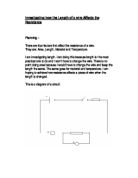
In this investigation a simple circuit will be set up to read the voltage and current when the length of the wire changes. I will measure the voltage and current at 6 different lengths and record the results in a table. These lengths will range from 5 cm – 30cm with intervals of 5cm. The length of the wire will be changed by moving the crocodile clip across the wire on a ruler. We decided that the best thickness of wire to use would be 30swg.
This is because a thicker wire would cause too much heat, and the resistance of a thinner wire would be high and difficult to measure. The reason for this is that a thicker wire has less resistance, because there is more room for the electrons to travel through it.
We did preliminary tests to ensure that the wire did not get too hot, and to determine how much power to use in the circuit. The power pack setting used was important, as it would determine how hot the wire got. If the wire got too hot, energy would be given off as heat, and the resistance would be increased. We did a test that used the same piece of wire at different lengths with a high and low power. The results showed that with a high power, the resistance was higher due to the wire being hotter. For this reason I will use a low setting to keep it a fair test.
The circuit should be set up as in the circuit diagram. It is important that the voltmeter is set up in parallel and the ammeter in series. The readings from the ammeter and voltmeter will be used to work out the resistance.
This can be done using the formula: R = V ÷ I.
Where V=voltage, I=current and R=resistance. R = V/I. This meant that I could find and record the resistance.
Apparatus:
Power pack, Voltmeter, Ammeter, 1m Length of Constantan Wire, Variable Resistor and Connecting leads.
Fair Test:
To ensure that the investigation is carried out in a fair way and that the results will be accurate and reliable a number of things must be followed. The only variable in the test will be the length of the wire. The wire must be pulled tight against the ruler and taped in place to ensure the length is accurately measured. The same circuit and power pack must be used throughout as different power packs may have different voltages if they are old. The experiment should be repeated 3 times and an average taken to make sure that the results are reliable.
Preliminary results:
Experiment Results:
Experiment A
Experiment B
Experiment C
Average Results
Graph:
Analysis:
The results from the graph give a clear indication of how the resistance compares to the wire length. There is a very strong positive correlation. This means that when the length of the wire increases, the resistance also increases. The results are also directly proportional, meaning that when one doubles so does the other. An example would be at a wire length of 5 cm, the resistance is 0.79Ohms and at 10 cm it is 1.44 Ohms. This is almost exactly double the size.
The theory behind this is explained in the prediction. In any given metal wire, there are a number of atoms and free moving electrons.
Electricity is the movement of these electrons through the wire. Resistance is caused when the free electrons moving through the wire collide with the atoms making their path through the wire more difficult.
This means that if there are more atoms in the way to collide with the free electrons the resistance is increased. In a length of wire there will be a number of atoms, and in a wire twice the length, there will be twice the number of atoms. In turn this will lead to there being double the number of collisions between the electrons and the atoms increasing the resistance by 2.
This explains why the results were directly proportional. For example a wire that was 10 cm long may have 500 atoms blocking the electrons. Therefore in a wire 20 cm long, there would be 1000 atoms meaning that the resistance had doubled.
Conclusion:
The results that I have obtained support my original prediction. This is because in the prediction I said that as the wire length increased, the resistance should increase. I also said that the link should be directly proportional. The results have backed this up.
The line of best fit clearly shows that the results followed the expected pattern very well. The points are very close if not touching the line. This shows how the results were directly proportional through out, as the gradient remained the same.
Other factors that change resistance
One factor that changes resistance is density. It has a large affect on the amount of resistance. The resistance depends upon the amount of denseness e.g. a large surface area has less resistance because a small area has tightly packed atoms which in turn rebound many of these electrons. Temperature has an affect on the experiment as well because the voltage has control over the temperature. The more the temperature increases the more the particles vibrate leading to a reduction in output voltage although not by a huge amount; this does have an affect.
And finally, the type of wire will depend on it’s resistance for example a nickel chrome wire’s resistance may be totally different to that of a constantan wire which I used.
Evaluation:
I don't think I could improve the experiment because it worked very well and got me some accurate results. I also found the experiment quite easy to set up as well. A further experiment I could do would be to see how the diameter of a wire affects the resistance. This would be very relevant because it is similar to the experiment I have done. However, I already know that other factors to affect the resistance are density and thickness because a thinner wire’s atoms are more tightly packed than those of a thicker wire.
Damian Gaskin
______________