- The length of the wire this is the only variable that I will be changing
- The temperature of the wire. I will try and keep this constant by only using on cell in my experiment
- The material of the wire. I will keep this constant by using the same wire throughout my investigation
- The thickness of the wire. I will keep this constant by using the same wire throughout my investigation.
Fair Test
To ensure that this investigation is a fair test and that my results will be as accurate and reliable as I can make them I will have to make shore that only one variable in the investigation changes and all the others will stay constant. To achieve this I will: -
- Pull the wire tight against the ruler and tape it in place securely so that I can measure the wire accurately.
- The same equipment all the way through the investigation so that I do not introduce variables by changing equipment.
- Only using one cell so that the wire only heats up minimally, because electricity creates heat and if the wire heats up it will change the resistance in the wire because it will mean that the atoms in the wire have more energy to collide with the free moving electrons. Due to the fact I am investigating wire length and its affect on resistance I want the wire to heat up as little as possible.
- I will use the same wire throughout so I don’t change the material or the thickness of the wire.
- I will repeat results where necessary.
Method
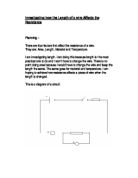
- Set up a simple circuit to read voltage and current when the length of wire changes.
- The length of wire use will be 100cm (1m), which will be tested at 10cm intervals.
- To change the length of the wire I moved a chisel edge across the wire on the ruler. The chisel edge I used is shown below and it was connected into the circuit with the wire attached.
- Record the voltage and the current for each 10cm interval
- Then work out the resistance by using the formula:
V = R
I
Where V = voltage, I = current and R = resistance.
- Plot a graph to show the relationship between the length of a wire and the resistance.
Diagram
Results
Graph
Analysis
The results from the graph give a clear indication that the length of a wire and the resistance relationship are directly proportional, meaning if one doubles so does the other.
I was able to make my prediction using the theory of free electrons. Where by electrons move through the wire and resistance is created by these free electrons colliding with atoms of the wire making their path through the wire more difficult. So a piece of wire has a set amount of atoms so in a piece twice the length would have twice the number of atoms meaning twice the number of collisions resulting in twice the amount of resistance. This explaines why the results are directly proportional.
The results I have obtained support my original prediction that as the wire length the resistance will also increase directly proportional.
Evaluation
This investigation was quite easy to carry out and I think that my results were more accurate that I first thought that they would be. This can be seen in the graph where by all of the points are on or very close to the line of best fit. This shows that the inaccuracy of my results was minimal.
Dew to the nature of electrical experiments I was expecting a larger level of inaccuracy mainly dew to human error. For example not getting a good connection with the chisel edge, reading the voltmeters and amp meters wrong, and errors with calculations of the resistance. Also inaccuracy could have occurred with the equipment for example having an old cell so it was running down. Other things that could have caused inaccurate results are not measuring each length accurately dew to the accuracy level of the meter ruler and accuracy levels of the amp meter and voltmeter.
If I decided to carry on my investigation I could investigate how wire thickness or how the temperature of a wire affected the resistance.