Resource: Advanced Sciences Biology 1 p.46
At low enzyme concentrations adding more enzymes increases the initial rate of reaction, giving the substrate more chance to bind to an empty active site.
At high enzyme concentrations adding more enzymes does not affect the rate of reaction hence the graph levels off. The reaction will be limited by other factors e.g. inhibitors.
The same pattern will be seen for increasing substrate concentration. As substrate concentration increases the initial rate of reaction will increase but then it would level off.
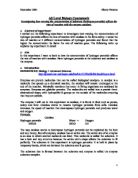
Another factor affecting enzyme activity is temperature. As temperature increases it will speed up the rate of reaction, as heat energy is transferred to the reactant molecules. This therefore increases the kinetic energy of the substrate and enzyme molecules, giving more energy for successful collisions. This will only work up to the optimum temperature of the enzyme. If heated too much the 3-D shape of the enzyme is altered until the active site no longer fits the substrate so the enzyme is said to be denatured. (See graph below):
Resource: Advanced Sciences Biology 1 p.47
The optimum temperature is the temperature at which the rate of reaction is greatest.
Changes in pH will also denature the enzyme as enzymes work in a narrow pH range so pH will alter the shape of the enzyme. pH is a measure of the concentration of the hydrogen ions (H+) in a solution. (See graph below):
Resource: Advanced Sciences Biology 1 p.48
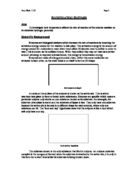
In this experiment I am choosing to investigate the affect of substrate concentration on the rate of reaction. I have chosen this variable because I think it will be the easiest of the variables to investigate, as I will be able to get different concentration of hydrogen peroxide easily.
I predict that the rate of reaction will increase as the substrate concentration is increased. I think this will be a directly proportional rate until a given time when the reaction will level off and the rate of reaction will no longer increase. This happens when the substrate concentration reaches a certain point and the solution will become saturated, at this point an increase in substrate concentration would make no difference to the rate of reaction. This means any additional substrate molecules have to wait until an existing enzyme-substrate complex dissociates to release products and free enzymes.
The increase in the rate of reaction when there is an increase in substrate concentration can be explained by looking at the amount of collisions. As substrate concentration increases, the number of favourable/successful collisions between enzyme and substrate molecules increase in a given time this means there are more successful reactions in that given time.
In my results I will be expecting to see the following pattern on my graph:
Resource: Advanced Sciences Biology 1
Apparatus needed for the experiment:
- Clamp and stand
- Biurett
- Catalase (celery)
- Hydrogen peroxide
- Conical flask
- Water bath
- Bung and tube
- Scales
- Stop watch
- Measuring cylinder
I have decided it is necessary to carry out a preliminary experiment in order to find out the best way to set up and use the apparatus. Also I want to find out what the best amounts of catalase and hydrogen peroxide are to use.
Here follows a brief method of how I am planning to carry out my experiment to test how the concentration of hydrogen peroxide affects the rate of reaction. This will be my preliminary experiment:
- Weigh out 15 grams of celery mixture (mush celery first) in a conical flask.
- Fill water bath with water.
- Fill measuring cylinder with water and place upside down in water bath.
- Steady measuring cylinder with clamp and stand.
- Place bung in conical flask and place the tube and biurett into the bung.
- Open biurett and release 10ml of hydrogen peroxide through the biurett.
- Start the stopwatch.
- Record amounts of oxygen being given off at timed intervals.
- What I found out from my preliminary experiment
During the preliminary experiment I found out that the reaction happened too quickly to take readings in shorted time intervals, so I tried using 10 grams of celery and 5ml of hydrogen peroxide, I found this worked better.
I am choosing to record the amount of gas given off every ten seconds as it will enable me to collect a large set of results making the experiment more reliable and it means I will be able to compare reaction rate at the beginning and end of the reaction.
I found some of the celery I used had mud on it, I tested to see if this affected the reaction rate, it only made a slight difference in results. I have decided in order not to affect results I will clean all the celery before I use it to make sure it is a fair test. Also I noticed that one end of the celery is whiter, I have decided not to use this part of the celery so it can not affect my results and the test will be fair.
In order for my reaction to occur best I have decided to mush the celery before I use it, giving it a larger surface area for particles to collide with. At this point I needed to consider whether the amount of juice produced when the celery is mashed would affect the reaction rate. I found it difficult to measure the amount of juice the celery produced so to keep the experiment fair I will only use the solid mush not the juice.
As my aim is to investigate how the concentration of substrate affects the rate of reaction I needed to chose the different concentrations of hydrogen peroxide that I would test. I carried out my preliminary experiment at different concentrations and have decided to use five concentrations of hydrogen peroxide. This will give me a wide range of results. I will use concentrations of 100%, 70%, 40%, 10% and 0%. In each case I will use distilled water to dilute the hydrogen peroxide. My 0% will be the control, it will be 5ml of distilled water. I am not expecting to see a reaction here. See table below to see amounts of hydrogen peroxide and distilled water to be used:
I will also carry out the experiment with 100% hydrogen peroxide on celery that has been in boiling water to see if that affects the rate of reaction. Here I would expect to see no reaction, as the celery would have been denatured by temperature.
Another consideration I have taken into account is whether to use fresh celery each time or if it was all right to use frozen celery. I thought maybe freezing the celery would denature the enzymes but when I tested this, frozen celery produced a reaction, so I have decided to use the frozen celery and defrost it. This means I won’t have to worry about getting fresh celery.
After carrying out my preliminary experiment I have decided to do my experiment as follows:
I will first set up the apparatus (listed before) as shown below:
Method
- Pour over 5ml of 100% hydrogen peroxide into the biurett (making sure the biurett is closed). Weigh 10 grams of the mashed celery and put in conical flask. Place bung on flask and have apparatus as drawn before.
- Open the biurett and release exactly 5ml of the 100% hydrogen peroxide into the flask containing the celery, close the biurett. As soon as the hydrogen peroxide starts to go into the flask start the stopwatch.
- As the reaction occurs bubbles should rise up the measuring cylinder and the water level will go down as oxygen is given off. Take readings of the amount of oxygen given off at 10-second intervals for 2 minutes 30 seconds.
- Repeat this experiment for hydrogen peroxide concentrations of 70%, 40%, 10% and 0%. The 0% will act as a control experiment to show no reaction occurs without hydrogen peroxide. Use distilled water to dilute the 100% hydrogen peroxide. Also carry out this experiment with 100% hydrogen peroxide using heated celery.
In order to make the experiment more accurate and to produce more reliable results I will repeat all the three times and then take an average. To make sure the test is fair I will use the same amount of celery and hydrogen peroxide in each test. Also to ensure a fair test I will try to keep the following variables the same each time: temperature, air pressure and humidity.
Most of the apparatus stated I had to use as it was all we had available to us but I have chosen to use a biurett to be more accurate when adding the hydrogen peroxide to the celery. It also means I do not waste time putting the bung on the flask as it can already be on the flask. This means no oxygen given off will be lost making the experiment more reliable. I have chosen to use celery as my catalase rather than liver catalase as there are less ethical issues involved in using celery.
To ensure the experiment is safe I will wear goggles and make sure any obstructions such as chairs are out of the way. Also as a risk assessment I have looked at the caution card for hydrogen peroxide.
From my results I have plotted a graph to show the amount of oxygen given off at each concentration of hydrogen peroxide. I have plotted all five concentrations on the same graph in order to compare the rate of reaction at each concentration. By calculating gradients, I have worked out the rate of reaction for each concentration of hydrogen peroxide in the first 30 seconds using the following formula:
Rate of reaction = amount of oxygen given off (ml)
(ml/second) time (seconds)
Concentration Rate of reaction/ml per second
100% 0.9
70% 0.36
40% 0.283
10% 0.13
0% 0
Looking at my graph you can see my results form curves. The curves start steep in the first 30 seconds, by looking at the rates of reaction in this time they support my prediction. When the concentration of hydrogen peroxide is increased the rate of reaction increases. This can be seen, as at 70% concentration the rate of reaction in the first 30 seconds is 0.36 ml of oxygen/ second. Then when the concentration of hydrogen peroxide is increased to 100% you can see the reaction rate also increases as 0.9ml of oxygen is now given off per second.
The increase in the rate of reaction when there is an increase in substrate concentration can be explained by considering the amount of collisions between the enzyme and substrate molecules. As the substrate concentration increases it increases the amount of favourable/successful collisions between enzyme and substrate molecules in a given time. So this means there are more successful reactions in that given time.
Looking at my graph you can see that the steepness of the gradient of each curve starts to decrease after 60 seconds. This shows that the rate of reaction is decreasing. (See table):
Concentration Rate of reaction/ml per second
100% 0.3
70% 0.23
40% 0.16
10% 0.05
0% 0
This table shows the amount of oxygen given per second in the last 30 seconds of the reaction I record.
I expected there to be a decrease in rate of reaction because at this point it can be said that the solution is becoming saturated. This means nearly all the active sites are occupied so the active sites are said to be saturated with hydrogen peroxide. If I had increased the hydrogen peroxide concentration at this point it would have made no difference to the rate of reaction because any additional substrate molecules would have had to wait until an active site became available.
On my graph you can see not all the points I have plotted fit the curves I have drawn. This could be due to experimental error causing inaccuracies. Also these inaccuracies could be due to inhibitors. As explained in my introduction, the active site of an enzyme fits one particular substrate perfectly. In competitive inhibition it is possible, however, for some other molecule to bind to an enzyme’s active site if it very similar to the enzyme’s substrate. This could inhibit the enzyme’s function. If an inhibitor molecule only binds briefly to the site there is competition between it and the substrate for this site. This could affect the accuracy of my results.
It is also possible for non-competitive inhibitors to reduce enzyme activity and therefore affect my results. Non-competitive inhibitors reduce enzyme activity by distortion of the enzyme structure caused by binding to some site other than the active site.
Looking at my control experiment (0% hydrogen peroxide) you can see there was no reaction, this shows hydrogen peroxide is needed in this experiment to cause a reaction with catalase. Out of interest I also carried out a quick experiment with the 100% hydrogen peroxide, I tested if there was a reaction with the celery if the celery had been boiled. Here I found there was no reaction, this show the celery had be denatured so could no longer act as a enzyme in this reaction.
I would say my experiment went fairly well as I obtained results that supported my prediction. I had repeated my experiment to make it more accurate and used a biurett to help accuracy. However when I plotted my results on a graph and drew a line of best fit, which started straight then turned into a curve I found I had quite a few anomalous results.
I found anomalies in the 100% concentration of hydrogen peroxide at 20, 70, 90 and 150 seconds. In the 70% concentration I found anomalies at 50, 60, 70, 80 and 120 seconds. Then in the 40% concentration there were anomalies at 20, 30, 100 and 110 seconds. Finally in the 10% concentration I found anomalies at 20, 70, 90, 100, 110 and 140 seconds. These anomalous results could be due to inhibitors as mentioned earlier in my interpretation. However the fact they are all slightly out could be due to experimental error and this means my accuracy could be criticised.
The following inaccuracies could have caused the anomalous results:
- As it was a long experiment I could not carry it out in one session, so therefore I used different celery each time this may have affected my results.
- It was difficult to be completely accurate when measuring the amount of oxygen given off each time as the measuring cylinder only has measurements to the nearest whole ml3. Also the readings could be affected by my speed of reaction of reading off the measuring cylinder.
- The precision of measuring the amounts of hydrogen peroxide, celery and water I used each time could have also affected my results, as it was difficult to be completely accurate. To make the measurements more accurate I could have used pipettes rather than pouring the hydrogen peroxide and water.
I could also improve this experiment in the following ways:
If I had the time I would do more repeats at each of the concentrations of hydrogen peroxide. This would make the average I took more accurate as it would mean errors, which could have been made in one experiment, would not affect the over all result so much.
To improve the accuracy of reading the amount of oxygen given off at timed intervals, I could ask someone to start and stop the stop-clock and call out time intervals while I recorded the amount of oxygen given off at each time interval. This would mean my readings might be more accurate.
Also to improve this experiment I should extend it to include more time intervals. I think if I had continued to take readings every 10 seconds for another minute it would have produced a better graph as my curve would have flattened off more as the solution became saturated. I could repeat this experiment for more concentrations of hydrogen peroxide so I could have more rates of reaction to compare. This would make my results more reliable.
I conclude that my final conclusion is valid because the evidence shows that my prediction was correct. This is seen in my results, on the graph it shows that the 100% concentration of hydrogen peroxide has the fastest rate of reaction. I feel that any uncertainties play little affect in making my conclusion any less valid as they can be justified by the inaccuracies I stated at the start of this evaluation.