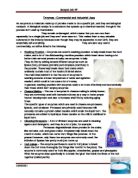
Solutions are at a temperature that the enzyme
You can do that by having tubes in the water bath with
The one in protease and pH solution (no film). Leave
For a couple of minutes mix then adds the film.
Apparatus:
1. Test tubes
2. Protease enzyme
3. Syringes
4. Squares of photographic film with gelatine in it.
5. Splints
6. Stop watches
7. pH solutions
Diagram
Method
-
Put different pH solutions provided into different test-tube. (In this case pH 5- 9 solutions)
- Put equal amounts in volume of protease solution into the different test tubes bearing different pH solutions in them approximately 5.
- Using splints take the photographic films which are smeared with gelatine and dip them into different test tubes containing the different solutions.
- Immediately start the stop watch and note the time at which each of the photographic films turns clear from black.
- N.B. The one which takes the shortest time to turn clear is the optimum pH.
- Draw a table and place in the results; repeat the experiment to get better results.
Results
- As you can see above the third timing has not been used to calculate the average for the graph.
- This is because there is more enzyme concentration than in any previous 2 experiments.
-
To get the average you: total of times = average time
Number of times
- To get the time in seconds you:
Time in seconds = time in minutes X 60
Safety
Put on lab coats to protect clothes and don’t put on open shoes
Put on Gloves to avoid any corrosive action hazards
Put on safety goggles to avoid hazards related to the eyes
Anticipation of any difficulties
1. If not tested properly the ph solutions may be slightly
Above or below their expected ph s thus interfering with the
Results.
2. If not labelled properly you may confuse the test tubes and
Thus hindering their final results
3. More enzyme may be put in mistakenly making the
Reactions faster thus interfere with the results.
4. The stopclock may be started earlier or later thus hindering
Results.
Solutions
1.ke time to test the pH solutions before any experiments are
To be started
2. Please label everything appropriately and carefully
3. Please be careful enough to put in the right amount of
Solutions
4.Try to be precise with the stop clocks.
Evaluation
I think the experiment on the pH was brilliant and this is because I found out that the optimum pH for enzyme action is pH 7. For lower PHS such 4 and 6, and higher PHS such as 8 and 9 it takes the enzymes longer to work on the substrate.
Conclusion
According to the graph I can see clearly that the time decreases for enzyme action with the pH increase until an optimum temperature pH 7 when instead the time increases for the enzyme action with the increase in pH
Problems I had while doing the experiment:
- When I did the experiment for the third time there was an increase in concentration such that the enzymes were reacting faster than the previous two experiments.
- The higher pH values took too long and thus wasting a lot of time and so did the lower pH values also.
- I had planned to use PH 5- 9 but instead available was pH 4,6-9.
- The stopwatches were hard to get used too since I would press the wrong buttons. This interfered with some results but I repeated every thing altogether.
- There was time wastage since I had one stopcock and I had to do the experiments a number of times.
Some solutions to these problems
- When I go the results of the third experiment I just recorded them but I didn’t use them to construct my graph because they would interfere with the results.
- I did the pH values, which took short times first, and then I concentrated on the long-term experiments.
- I used instead the available pHs and worked with them accordingly.
- I practiced with the stop clock a number of times to get me accurate.
- For the future experiments I suggest multiple stop clocks to be able to start off many experiments especially the long term ones at a go.