- -
BIOLOGY COURSEWORK
INVESTIGATING OSMOSIS
A. PLAN
Aim of investigation: To investigate the effect of different concentrations of sucrose on osmosis in potato chips.
Definition of osmosis: Movement of water molecules from a dilute to concentrated solution across a partially permeable membrane.
Independent variable: Concentration of sucrose solution.
Range of values (details of dilutions):
Dependant variable: The mass (grams) and length (mm) → Size of chip
The length will be measured accurately with a ruler, rounded to the nearest millimetre. The mass will be measured on an electronic balance to the nearest 0.5g. Before these steps we must blot first to remove the sucrose solution from the outside of the chip as if it remains then we won’t get the required reading (as the chip will weigh more than it actually is).
How to control the variables:
Apparatus:
15 x Test tube
1 x Stirring rod
1 x Beaker (250cm³)
15 x Equally cut potato chips
1 x Measuring cylinder (10cm³)

1 x Water bath (filled)
1 x Chipper
1 x Syringe (10cm³)
1 x 1M Sucrose solution
1 x Scalpel
1 x Ruler (30cm)
1 x Apron
1 x Electronic balance
Method: Collect apron and goggles and collect above apparatus. Cut potato using chipper into chips. Choose 15 similar chips and record in a table the mass of them all. With three test tubes of each concentration (15 in total), I allocated different solutions to each of the tubes; Tube 1 should contain 0.5M sucrose solution, Tube 2 should have 1.0M sucrose solution and Tube 3 should have 0.75M etc. ...
This is a preview of the whole essay
1 x Water bath (filled)
1 x Chipper
1 x Syringe (10cm³)
1 x 1M Sucrose solution
1 x Scalpel
1 x Ruler (30cm)
1 x Apron
1 x Electronic balance
Method: Collect apron and goggles and collect above apparatus. Cut potato using chipper into chips. Choose 15 similar chips and record in a table the mass of them all. With three test tubes of each concentration (15 in total), I allocated different solutions to each of the tubes; Tube 1 should contain 0.5M sucrose solution, Tube 2 should have 1.0M sucrose solution and Tube 3 should have 0.75M etc. Place each of the three chips in one of the test tubes and leave them for 12 hours (ensuring they are in the same location). They are then taken out and the mass is recorded.
I will be taking 5 readings so that I can plot a valid graph. And the range of values I will need to use for the independent variable are; 0.0M, 0.25M, 0.50M, 0.75M and 1.0M.
I’ll need to repeat my experiment three times to make my results reliable.
Prediction of what will happen:
- Chips in distilled water will get bigger (weigh more) and become turgid.
- Chips in the 1M sucrose solution will get smaller (weigh less) and flaccid (and chip in 0.5M solution will also be smaller and flaccid but not as much as the 1M chip).
Explanation: In distilled water, water molecules will move by osmosis through the fully permeable cell wall and semi-permeable cell membrane in the chip cells from a dilute solution outside the cell to a more concentrated solution inside the cell. The below cell is turgid due to this.
However in the 1M/0.5M sucrose solution chips, the cell becomes flaccid because water has moved out of the cell by osmosis, through a fully permeable cell wall and a partially permeable cell membrane in the chip cells from a dilute solution inside the cell to a concentrated solution outside the cell.
Methods used during preliminary experiments: I will take 3 chips. One will be placed into a test tube of distilled water, one will be placed in a test tube of 1M sucrose solution and the last chip will be placed into a test tube of 0.5M sucrose solution. I’ll measure first the initial mass and lengths of the chips, leave them for 40 minutes and take them out, and measure the mass and length again.
Preliminary Results:
I used these results to help me decide on the details of my method. Firstly the change in mass is very small (e.g. 0.46g) which means that I will decide to leave it for longer than 20 minutes. For a set of accurate results I will decide to use a range between 0M and 1M. We experimented with the size of the chips. We found that they need to be the same length, so I’ve decided to cut them all 5cm long. I also found out that they needed 10cm³ of solution to cover the chips. Finally we decided to measure the chips using the mass because it is more accurate as the scales are electronic and are able to measure even the most minute changes in mass (much better than using a ruler to measure the change in length because we will get measuring errors).
B. RESULTS
BEFORE:
AFTER:
% Change in mass analysis:
(Final Mass – starting mass) / Starting mass x 100%
Note: All % change figures are rounded to 3 significant figures.
Average value comparison:
Addition of total values wishing to average / Number of values:
C. ANALYSIS
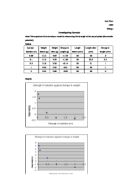
By looking at the % change in mass table, we can state that as the sucrose solution concentration increases, the % change in mass decreases.
Here is a rough draft of the graph which will appear later:
We can say that there is an inverse relationship between the concentration of sucrose and the % change in mass. This is because at 0M there is a positive % change in mass and as we further increase the concentration we see a decrease in % change with most concentrations having a negative % change in mass. However as we continue to increase the concentration the % change in mass continues to decrease but at a much slower rate. The sharpest decrease only occurs from 0M to 0.5M.
My graph shows that as concentration increases, % change in mass goes down and eventually flattens out and it is shown by a negative inverse relationship.
Explanation of the results: Water molecules moves into the chip by osmosis because there is a higher concentration of water inside the chip than outside. Water molecules move from a high water concentration to a low water concentration, through a partially permeable membrane.
Comparison of prediction and results: I predicted that the chips in the distilled water (0M) would get bigger and would weigh more by becoming more turgid. I also stated that the chips in the 1M and 0.5M sucrose solution would become smaller and would weigh less as they become flaccid. I can say that my hypotheses have been proven by looking at the results and by clarifying the prediction. This is because before for the 0M chip it averaged a mass of 4.36g, and after it averaged 4.73g. Similarly, for the 1M chips, before they averaged 4.31g and after they averaged 3.61g. For the 0.5M chips, before they averaged 4.32g and afterwards they averaged 3.94g. So my prediction has successfully been proven by my results.
D. EVALUATION
Anomalies in the results: I found only one anomaly in my results and that was with the 3rd chip in the 0.25M sucrose solution. This is because firstly it had a mass of 4.15g and then afterwards it had a final mass of 4.51g, which is unusual considering that the other 0.25M chips only showed a very slight increase in mass. I think the amount of sucrose solution which was added to the test tube of this chip was not measured accurately or the amount of water which was used to dilute the sucrose was not measured accurately. So if the concentration was higher then more water molecules would be able to enter the chip from a dilute solution to a concentrated solution (inside the chip). Unfortunately, this abnormal increase in mass also affected the % change in mass which in turn affected the graph as I averaged the % change in mass to do the graph. But the graph is still able to show a good understanding of the relationship between % change in mass and concentration of sucrose. Other possible explanations of what might have happened to the chip could have been that it wasn’t cut properly, wasn’t blotted evenly, some chips floated whereas others didn’t, not all of the potato skin was removed and some chips were stuck to the side of the test tube.
How to improve the method: Due to the anomaly which has been found, I would suspect some inaccuracy in the method I used. I poured the relevant amount of sucrose solution first and then added the volume of water later without checking that they both added to give 10cm³ of solution. But what would have been a much better method would been to have added the sucrose solution and water to a measuring cylinder and checked to see if they both added to give 10cm³ of solution and then if they do, pour into the test tube with the chip inside. Also when we took the chips out afterwards to measure the mass again, we should have made sure that we removed the sucrose solution which was still on the chip because it would have increased the mass of the chip slightly. The timing was also not taken into accord. We didn’t take all the chips out to measure at the same time. Also we did not control the temperature which would have had an effect on the experiment. Other than those problems, the method was done quite accurately.
Enough data to be confident about the pattern of results? Yes I strongly believe that I have managed to obtain data to be confident about the pattern of results. This is because I can simply observe from the table that the results follow some sort of trend/pattern. However it would have been better to have done more concentrations of sucrose experiments so that we could see how the graph would flatten out, but unfortunately we did not have more experimental time. Also if we had done more repeats (e.g. 5 instead of 3) we could have eliminated the anomaly and we would have been able to take much more accurate averages (which would have given a more accurate graph). But I am pleased with these results as it successfully proved my prediction.
Would the results allow me to work out the concentration of water inside the chip? Yes, we can see where the line is able to cross the “x” axis. However this is proven to be inaccurate because I am only assuming using the line of best fit and also there is no data for that point.
Further work which could add extra information? There is a lot of further work we could do. We could have done more concentration levels within our range which would give us a more broad view and would increase reliability of our present results, we could use salt solution instead of sucrose solution to see if the same applies with other substances, we could increase the size of the chips to see if rate of osmosis correlates with size, we could see the change in length instead of the change in mass to see if there is a relationship between length and rate of osmosis, we could leave the chips for a different period of time and we could also use a much wider range for our range of values which again provides us with a wider variety of results from which we can compare to get more accuracy. We could benefit hugely by doing these additional theories because we would have a much better understanding of osmosis, and also we could compare what effects these changes would have on osmosis and finally we can understand better of which conditions and limitations are best for optimum osmosis.