Hypothesis;
A cuboid of potato will gain mass if it is placed in a weak solution and will loose mass if placed in a strong solution.
Preliminary work
We carried out a preliminary experiment in order to find a suitable plant tissue for our main experiment. We looked at three different plant tissues (Apple, Banana and Potato) . Cuboids of each tissue were cut weighed and placed into a sucrose solution. Twenty four hours later the samples were removed dried and weighed. It was noticed that the Apple and Banana cuboids had discoloured and begun to disintegrate whereas the potato cuboid had not. The potato cuboid was removed from the solution and weighed. It had lost a significant mass.. We repeated the above experiment using a saline solution instead of a sugar solution, the results were similar but the potato sample showed slight evidence of disintegration and discoloration. We chose potato as the most suitable tissue and sucrose as the most suitable solution.
Apparatus
For the experiment we will require;
A potato
A potato chipper
Sugar (Sucrose) solution of known strength.
Tap water (to produce a range of sucrose concentrations)
Test tubes
Test tube holder
Scalpel
Cutting tile
Tissue paper
Measuring Cylinder
Marker pen
Electronic top pan balance
See also diagram 1
Method
We used the potato chipper to produce uniform potato sticks which we then cut the sticks into 5 cm. lengths using the scalpel and cutting tile. We then weighed each 5cm cuboid using
the top pan balance and recorded the weights. We made up a series of 5 sucrose solutions of differing concentrations, using the provided sucrose and tap water. We then added the solutions to marked test tubes and added the weighed potato cuboids. The test tubes were then left for 24 hrs at room temperature. After 24 hrs the samples were removed from the test tubes quickly dried with the tissue paper and weighed. The weights were recorded.
Safety
Usual laboratory safety rules were followed but particular care was taken when using the scalpel. Care was also taken with the glassware.
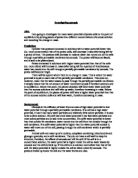
Results
The readings are recorded in table 1.
The results are consolidated in table 2.
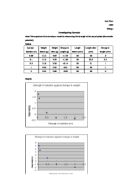
Graph 1 shows how the mass of potato changes as the concentration of sucrose changes.
Analysing Evidence
There are 7 points plotted on chart 1. Numbered from the left hand side .
Between points 1 and 2 (high water potential ), there is little indication that the cell is increasing further in size. This is because the cell is fully turgid and no more water can enter.
At point 3 the graph suggests that no osmosis ( water movement ) has occurred, suggesting that the concentration of water inside the cell is equal to the solution outside.
Between points 6 and 7 (low water potential ), there is no indication that the cell is decreasing further in size. This is because the cell is fully plasmolysed and no more water can leave the cell.
This could be explained by the following scientific knowledge . Even if the solute concentration external to the cell is low relative to the vacuole contents, cell will not continue to take in water by osmosis for ever. The cellulose cell wall prevents this. A cell that is full of water is said to be turgid and cannot expand further as the outward pressure on the cell wall is balanced by the inward force of the stretched wall.. At the other extreme, a cell placed in a solution that is high relative to the cell contents will lose water by osmosis. The cytoplasm will cease to exert a pressure on the cellulose cell wall and the cell, described as flaccid, will lack support. Water loss can continue to such an extent that the cytoplasm, and attached cell membrane, contracts and detaches from the cell wall. A cell in this condition is said to have undergone plasmolysis. This very rarely, if ever happens in nature
The prediction made is supported by the evidence obtained from this investigation. It shows that the potato cells increase in mass in solutions with a high water potential and decrease in mass in solutions with a low water potential . At concentrations above 0.7 M, there appears to be no further water loss, suggesting that the cell is fully plasmolysed.
From the graph an estimate of the concentration of the potato cell can be made as 0.29 M. As this is the point where the potato is not increasing or decreasing in mass. However, it is important to realize that this is only an estimate as all potato cells will not be uniform in their concentration.
Evaluation
The graph obtained in the results is roughly in line with my predictions. This suggests that the experiment was fairly accurate. The accuracy of the investigation was adequate, however there are some improvements which could be made;
Solutions were made up using a measuring cylinder and could be made more accurate using a burette.
I believe that my results were quite inaccurate this could have been because . When the potato was dried to remove surface liquid it was not necessarily done the same on each potato, a more accurate and uniform way of drying would improve the accuracy further.
Although 3 repetitions of each concentration are sufficient, there was a possible anomalous result the reading with the sucrose solution of .37 this is anomalous result because it does not seem to fit the pattern that the rest of the results do . This part of the investigation would need to be repeated with more replication .
Using tap water instead for distilled water may have change the out come of the test because of the chemicals in the water .
A controlled environment cabinet could have been used to ensure variables such as temperature and light remained constant. This is important as changes in temperature or pressure may effect the performance of the partially permeable membrane..
Further work could be carried out to include concentrations that increased in 0.1 M or 0.5 M steps. This would improve the graph and increase the accuracy of the findings.
Other investigations could include using different varieties of potato or different plant tissues e.g. carrot . I could also have done more experiment into fruit to find out why plant and fruit react differently under osmosis . I could have use salt and glucose to see if these solutes produce different results. (If molar concentrations are used there should be no differences). I could also find more accurate ways of measuring the mass of the potato. I could also have a more accurate time of leaving the potato in the solution because although 24 hours is sufficient it was not very accurately timed . (I presumed that the pressure and climate conditions were the same although out my experiment . )
I f I had the time and the technology I needed I would have liked to look at the following experiments
- Leave the test for different lengths of time so that we might of been able to calculate the rate of osmosis in the same conditions .
- We could have also changed the conditions to see if that would change the rate of osmosis for instance if the temperature was raised a faster the rate of osmosis could be expected.
- We could have also find out if pressure would effect osmosis in any way if we had suitable apparatus.
- We could have also seen if there was a difference rate of osmosis in different types of vegetables e.g. root vegetables and vegetables that grow on the ground ( peas) . This would have been interesting because the root vegetable was made by the plant to hold all of the nutrients needed to promote the potato seedling to grow with out sun light .
Research
Gallagher and Ingram , 1999 , Complete Chemistry , Oxford
www.google.com as a search for GCSE osmosis course work