As well as the concentration there are other factors that will affect how well the experiment will work. These include the following:
Temperature
It is important to ensure that the experiment is carried out at a consistent temperature. If it is too hot the chip will cook, if it is too cold the chip will freeze. I am proposing to carry out this experiment at room temperature, but it would be advisable to check the results in an experiment at a temperature recommended by Mccoin.
Light
If a potato is left in daylight it will go green, so the experiment should be kept under dark conditions.
Types of Potato
If you use different varieties of potatoes, then you may get different results, as they may have different chemicals compositions.
Time
You have to leave it for an appropriate amount of time for the osmosis to take place.
Prediction:
I think that, the lower the concentration of solution X the larger the chips will get in length and mass, because the water will move from the solution to the chip, i.e. the water will move from an area of high concentration of water molecules to an area of low concentration of water molecules. With a higher concentration of solution X the opposite would happen. If the concentrations are equal there will be no movement of water due to the equilibrium of concentrations, and the chips would remain the same size. This will be the correct concentration of solution X that the scientists would need to keep the chips in. This concentration, if my prediction is right should therefore be 0.2M or less.
I am planning to obtain results on the mass and length of the chips with and without the pin, from each concentration of solution X, after they have been left for a period of time. I think that the results from the two chips in each concentration of solution X, will be sufficient (I marked one chip with a pin to make sure that I could measure the results properly).
Method:
- Collect the necessary equipment (shown on previous page)
- Using the chip cutter to cut out 8 chips from the potato.
- Cut them each using the knife, to a length of 2.5cm using the tile to lean on.
- Put a pin through the centre of just 4 of them.
- Measure the mass and of each chip, and record it.
- Put two chips in each boiling tube, one with a pin in it, and one without.
- Fill four boiling tubes, each with one of the following concentrations of solution X, 0.1M, 0.2M, 0.3M, and 0.4M.
- Leave for roughly 2-3hrs.
- Come back and measure the length and mass of each chip, and record it.
- Replace chips and leave for further necessary observations if you wish.
I think that this is a good method to use, because by putting two chips in each boiling tube, and then a pin in one of the two chips, once you have your results, you can take an average. This way I can have more precise results. By choosing a range of concentrations I will be able to make a graph of the results and predict the equilibrium of concentrations.
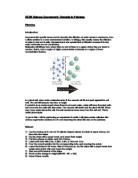
Diagram:
Concentrations of solution X
0.1M 0.2M 0.3M 0.4M
Boiling tube
20ml of solution X Chips
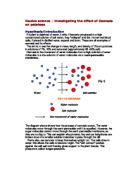
Previously we had carried out an experiments on osmosis, we used leeks to demonstrate the effects of osmosis. We cut two pieces of tissue from a leek. We placed one into a beaker of distilled water, and the other into a beaker containing a concentrated sugar solution. We left them for about half an hour, then when we removed them. We found that the leek that had been put into the beaker of distilled water had grown in size and was hard and stiff, this was because the water concentration in the beaker was much higher than the concentration of water in the leek, meaning that water had moved into the leek by osmosis, from an area of high concentration, to an area of low concentration. The leek that had been left in the concentrated sugar solution became soft and floppy, and shrank in size. The water concentration in the potato was greater than the concentration of water in the beaker, meaning that water moved out of the potato by osmosis.
“Osmosis is the movement of water across a selectively permeable membrane:
- From a lower concentrated solution to a higher concentrated solution
- From where water molecules are at a higher concentration to where they are at a lower concentration
-
From an area of higher water potential to lower water potential.”-Letts A-level Biology
“Osmosis is a special example of diffusion where only water moves into or out of cells. It occurs because cell membranes are semi-permeable or partially permeable- they allow some substances through them but not others.”-Collins GCSE Science
Obtaining Evidence
Having set up the experiment we ensured that it was safe by wearing goggles to protect our eyes from the solution X, because although we knew it was similar to sucrose, we did not know exactly what it was. We also wore our lab coats so as to protect our clothes. When we carried out the experiment we used four different concentrations ranging from 0.1M-0.4M, going up every 0.1M, to make sure that we would to be able to illustrate a trend between results, when we drew up our graphs, and therefore enabling us to draw a sensible conclusion. We did the experiment twice in one go, by putting two chips per boiling tube, and then from the two results we took an average, to make it more accurate. We used a ruler measuring to the nearest millimetre to obtain precise results, when measuring the chips before and after. When we weighed the mass of each chip, we took it to two decimal places. We recorded the results in a table when we first took them down to display them clearly. I decided to put the results into a scatter graph, and draw a line of best fit to demonstrate the general trend of results, as the results were not going to be absolutely perfect. Had I done a line graph, the line would not have been straight, therefore not illustrating the constant decrease in size of the potato as the concentration of solution X went up.
Analysing Evidence and Drawing Conclusions
From doing this experiment I have found out that the concentration of solution X, which is necessary to keep the chips the same size, is between 0.1M and 0.2M.
Having recorded the results into a table we then transferred them onto a scatter graph, and drew in a line of best fit, so we could easily observe the results. For the scatter graph we had the percentage difference shown on the y-axis, and then the concentration shown on the x-axis. I worked out the percentage difference by using the following equation:
average change÷ average original ×100
1
From these results I noticed that the concentration at which there was no percentage difference for the mass was 0.175M, and for the length was 0.11M. From the graph you can see that as the level of concentration of solution X increases, the change of size in the potato decreases. This is evident in both the graphs for the length and mass of the potato. Both graphs show negative correlation.
This has happened due to osmosis. The lower the concentration of the solution, the higher the concentration of water molecules, and the opposite when the concentration of the solution is higher. In osmosis, only water is able to move through the cell membrane. In this case when there was a higher concentration of water molecules (dilute of solution X), than the concentration of water molecules inside the chips, the water moved from the area of high concentration to the area of low concentration, therefore enlarging the chip in both mass and length. When the concentration is lower on the outside the complete opposite is going to happen, because the water will move from the chip to the solution, from an area of high water potential to an area of lower water potential.
My prediction proved to be correct. I had thought that the lower the concentration of solution X the larger the chips would get in length and mass, because the water would move from the solution to the chip. And the higher the concentration of solution X the smaller the chips would get in length and mass, because the water would move from the chip to the solution. My prediction matches exactly with the explanation of my results, even though the actual results were not completely precise, but that was not to be expected, as we were not taking the utmost care when carrying out the experiment.
Evaluating Evidence
I think in this experiment worked well in certain aspects, because our results show a reliable trend, which agrees with my prediction. I have also been able to analyse the evidence, and although I haven’t been able to come up with a complete solution to the given problem, I found that the necessary concentration at which there will be no change to the chip would be between 0.1M and 0.2M. It would be necessary to do further experiments to find a complete solution to this particular problem.
I think that our results were accurate enough for this experiment, because it gave us a basic but clear understanding of how the different concentrations affect the chips. However if it were to be carried out on a larger scale the procedure would have to be carried out more accurately. If I were to do the experiment again, I think I would use a larger range of concentrations, so as to be able to obtain more results, giving a more accurate graph. I would also ensure that it was carried out more accurately.
The method used for this experiment was suitable not for finding out the concentration of solution X at which the chips will not change in size, but for starting the investigation into it. We managed to obtain results that showed us which concentrations would be suitable for keeping the mass or the length of the chip the same. However, if an average were taken of these two concentrations, it would not necessarily mean that concentration would work. Further tests would need to be carried out.
If any other experiments could be carried out to extend this work, I would suggest that an experiment was done testing the firmness of the chip when put in the different concentrations of solution X. In addition, an experiment similar to the one we have carried out, but more detailed.
Percentage
Difference
Concentration
Percentage
Difference
Concentration