If the temperature of a piece of wire increases the atoms gain energy making them vibrate at an increased rate, causing free electrons to have more difficulty getting through the spaces between the atoms meaning their progress will be impeded. This increases the resistance value.
Ensuring a Fair Investigation
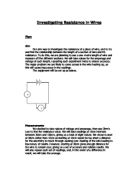
To be sure of a fair test, we decided to leave a set time of 60 seconds between each test to let the wire cool. We also aligned the centre of the crocodile clips with the number to ensure the clip was in the position relative to the number, as below.
50cm Wire
Crocodile clip
We also conducted all of the experiments in one session to ensure we used the same equipment for each test. We also took readings for each length twice, to guarantee total accuracy.
Prediction
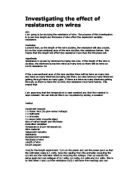
I predict that as the length of the wire increases, the resistance will also increase as the free electrons have more atoms to travel between. I think that if the length of a section of wire is doubled, the resistance will also double, as there are twice as many atoms for the electrons to pass between.
2cm 4cm
15 atoms 30 atoms
Above the resistance in the second diagram will be double the resistance in the second diagram as it is twice as long with double the number of atoms.
Observation
Table of results
The first time we did the investigation, we got a very unreliable set of results, after investigating the cause, we deducted we had a faulty battery pack, so decided to re-do investigation, this time our results were a lot more reliable, but to ensure accuracy, we repeated each length twice
These results seem a lot more accurate, and the readings for each length were mostly the same with only two variations in the readings for voltage, these being 80cm and 40cm.
This slight difference could be due to a difference in the electricity produced by the battery pack or a difference in positioning of the crocodile clips, although we did try to prevent this. After investigating the cause, we deducted that the difference was due to the battery pack, as when we changed the pack, the voltage rose again.
Analysing Evidence
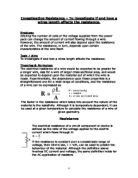
From the graph, I can see that the results are fairly accurate as the line of best-fit runs straight through the middle of the results. This shows there is an obvious relationship between the length of a wire and the resistance. The relationship shown in the graph proves my prediction to be correct (subject to comments in evaluating evidence). The resistance rises proportionally with the length; the result for 60cm is approximately twice as much as the resistance for 30cm this means there is a direct relationship. This is due to the fact that free electrons have twice as many atoms to pass between. (See diagram above).
To authenticate the preliminary readings, we repeated our investigation in reverse; this helped us validate our original results.
Evaluating Evidence
I found no anomalous results. This shows that the readings taken were reasonably accurate.
The variations in the results can be accounted for by many factors:
- In a school environment it was difficult to guarantee total accuracy of the length of wire under analysis, due to inaccuracies in the positioning of the crocodile clips.
- The accuracy of the measuring equipment, meaning the current and voltage were rounded to two decimal places therefore not necessarily accurate.
- We assume the cross-section of the wire is constant throughout the length, i.e. a constant diameter.
1mm diameter 0.950mm diameter
1 x 3.142 = 3.142 mm² 0.950 x 3.142 = 2.985 mm²
This change in diameter will cause a funnel effect, restricting the progress of the free electrons between the atoms, This would provide inaccurate results, leading to a false impression. If this fault occurs at the start of the wire it will affect all the results, if it occurs towards the end, it would change the pattern of results, causing incorrect placement of the line of best fit.
Improving the accuracy
The accuracy of this test can be improved in many ways:
- The use of a Jockey (thin blade contact) to increase accuracy when measuring the sections of wire, guaranteeing accurate lengths.
- Higher specification (more accurate) Ammeter and voltmeter.
- Increase increment value i.e. 100cm. steps instead of 10cm, broadening the range of results leading to a more accurate graph.
- Add one large distance to confirm analysis of linear relationship (see analysis for extrapolated result)
- The use of a constant power supply as the batteries will drain during the test, falsifying the results.
- Ensure wire is of a constant cross-section (see above).