Current is the rate of the flow of charge (Q), I= Q/ t
Therefore a larger current means more electrons passing through the metal each second. Current is measured in amperes (A), and is represented by the symbol, I.
Batteries, the mains, dynamos and electrical generators provide the energy to force electrons around electric circuits. Voltage is the measure of energy available to drive a current, so the bigger the voltage is, the greater the ‘force’ making electrons go round a circuit. Voltage is measured in volts and is represented by the symbol, V.
Ohm’s Law
It is necessary to know of Ohm’s Law, as this is the way the resistance is calculated. The resistance (R) of a length of wire is calculated by measuring the current (I) in the circuit and the voltage (V) across the wire. These measurements are then applied to this formula:
R=V/I
This formula is Ohm’s Law, which states that voltage and current are directly proportional because voltage the amount of energy pushing the charge, and current is the rate of flow of charge, so therefore the more energy to push the charge (voltage), the faster the rate of the flow of charge (current) will be.
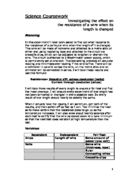
Variables
These are the factors that may have an affect on this experiment. We are going to have to control these factors in order to have a fair test:
This is our key variable, as this is the factor that we are going to change throughout the experiment. By changing the length of the wire, this will have an effect on the resistance, as the two are directly proportional. We measured the length of wire using a meter stick, and applying crocodile clips at correct intervals.
This is a controlled variable, as it is constant throughout the experiment. If we supply more current, this will affect the resistance as resistance is measured by the energy pushing the electrons around the circuit, and the rate of the flow of the electrons, (R=V/I). We will control this variable by carefully reading the ammeter, making sure it is at exactly 0.20 amps, and recording our results.
This is also a controlled variable, and we have used 28 SWG NICHROME wire throughout the experiment. This is because different material as have different numbers of free electrons in them, and these free electrons collide with the fixed electrons in them, and the energy lost as a result of these collisions is resistance; so if we changed the material, this would change the number of free electrons, which would change the number of collisions, which subsequently would change the resistance.
This is our dependent variable as this is the one we will measure so we can calculate voltage, and by using voltage and current (0.20 amps) we can calculate the resistance. If we increase the voltage this will increase the resistance in accordance to Ohm’s Law (R=V/I). We measured the voltage by carefully reading the voltmeter.
This is also a controlled variable, and at a higher temperature, resistance too is higher. This because at higher temperatures the atoms in the metal vibrate more, so that electrons are more likely to bump into them. Therefore the number of collisions’ increases, causing an increase in resistance. We controlled temperature by doing both sets of experiments in one area, at a constant room temperature.
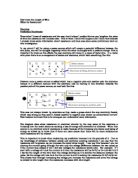
Circuit Diagram
Apparatus
- 1 x Power Pack
- 1 x Voltmeter
- 1 x Ammeter
- 4 x Normal wires
- 2 x Crocodile clips
- 1 x Meter stick
-
1 x wire reel, to have wires of varied length
Method
- We set up the experiment as shown in the diagram, and attached the power pack to the mains.
- We measured the length of the wire by sticking wire across a meter stick with masking tape, and attaching crocodile clips, at different intervals to give us the correct lengths of wire. This method was not very accurate, as the intervals were only a centimetre wide, and the crocodile clips often slid off their positions. We attached the crocodile clips at adequate positions (at 10cms, 20cms, etc.)
- We made sure the current was at a low reading on the power pack, switched it on, and then gradually increased the current, till the reading on the ammeter was at exactly 0.20 amps, on the ammeter- an accurate method of measurement (as it measures to a hundredth of an amp), we then recorded the reading on the voltmeter- carefully reading the voltmeter, which measures to a hundredth of a volt- an accurate form of measurement.
- We switched off the power pack and repeated the process- steps 2-4 with each different length of wire. After we had tested all nine lengths of wires, we repeated the entire experiment again, so we had two sets of results.
We decided to collect a range of 9 different results, at this will provide us with the sufficient number of results to draw conclusions from. Also we have measured the lengths at regular 10 cm intervals, this way we minimise the risk of inaccurately measuring the length of wire. We will use 28 SWG nichrome wire.
Safety Precautions
As we were using electricity, we made sure our hands were dry, so we didn’t electrocute ourselves, and made sure we did not touch live wire and burn ourselves. We also made sure that current was always below 0.20 amps, as we did not need to use higher currents, and if we did use a higher current, we may have melted the wire. Also when we were cutting the wire we wore goggles in order to shield our eyes from any shards of wire. We also made sure we did not run around the lab, in order to avoid risk of injury.
Skill Area O: Obtaining Evidence
Results of the Experiment
We used 28 SWG nichrome wire
Skill Area A: Analysing Evidence
In the graph of length of wire (cm) against resistance (Ω), the straight line is of a positive correlation, and goes through the origin.
I conclude that the length of a wire does have an effect on its resistance, and that the two are directly proportional, because if we increase the length of wire by a factor, the resistance too increases by the factor. Furthermore, if the length of wire is doubled, resistance too is roughly doubled, as proven by my graph, e.g. at 40cm the resistance is
At 4.10 Ω, and at double this length, at 80 cms, the resistance is at 8.15 (nearly double as 4.10Ω*2= 8.20Ω-this also proves that our graph is directly proportional. However we cannot be sure about other materials, and each material has a different resistance, so we can extend our investigation to testing other materials to find out whether they follow my findings.
This is because by changing the length of the wire, this will have an effect on the resistance, as the two are directly proportional (increase one by a factor, the other will increase by that factor), as resistance is calculated by of Ohm’s Law. The resistance (R) of a length of wire is calculated by measuring the current (I) in the circuit and the voltage (V) across the wire. These measurements are then applied to this formula:
R=V/I
This formula is Ohm’s Law, which states that voltage and current are directly proportional because voltage-the amount of energy pushing the charge, and current is the rate of flow of charge, so therefore the more energy to push the charge (voltage), the faster the rate of the flow of charge (current) will be. And as a longer wire has a higher voltage, the resistance therefore too increases.
The graph line has shown that my results follow a pattern, as all our points follow a clear positive correlation against the line of best fit. We cannot be sure whether this trend will carry on forever, whether the resistance will always be directly proportional to the length of a wire by a factor of 2, so we could possibly test a wider range of wire lengths, till 10m, to see whether the line of best fit is constant.
Skill Area E: Evaluating
We had no anomalous data, as the graph line shows a clear pattern as all my points follow the line of best fit. I had no anomalous results, I can tell this as all of my points followed the line of best fit, and followed a clear positive correlation.
I regard the quality of the evidence as acceptable, as all of our points on the graph line show a clear pattern, following the line of best fit; this shows that the evidence collected is accurate, as a clear trend within the results can be identified by looking at the graph.
I think that this experiment is reliable, because when we repeated the experiment we got similar results to the first experiment, thus showing that the experiment is reliable because it has shown that we conduct our experiment with a consistent level of accuracy.
The procedure was relatively simple and provided us with results that showed a clear trend, however the experiment itself was not absolutely accurate as the procedure was unsuitable. The problems that we faced within the experiment include the straightness of the wire, as the wire we were supplied with had kinks within it, thus increasing the length of a wire, so the length of wire we had measured was not completely accurate. This could be improved by using wire that lay horizontally, i.e. Not wrapped around a reel, as this encourages kinks, whereas if the wire was always stored on a wide horizontal reel, this would mean that less of the wire gets bent, therefore helping to keep the wire straight.
Another problem we faced within this experiment was that we used metre rules when we measured the length of wires, which only showed width to a centimetre. This meant that when we measured the lengths of the wires, the measurements may have been slightly over/ under the correct amount. We could solve this problem by using rulers that are a metre long, and are accurate to the width of a millimetre, as this would help us increase the accuracy of wire length.
Another problem we faced was when the crocodile clips we had used to clip onto the wires, often slid off their positions, meaning that the lengths of wire varied from the required lengths. This problem could be solved if we used small vices to securely grip the wire, at the required positions, as this way we will be sure that the wire is exactly the right length, as the vices will not move, and will have a firm grip upon the wire.
Again if we used vices, instead of the tape when taped down the wire to the ruler, it would have meant that the length of wire will be completely accurate, and not be weak like the masking tape, which allowed the wire to move, thus changing the length of the wire because this meant that it was not completely straight.
To make this experiment a good procedure, we used ammeters and voltmeters that were accurate to a hundredth of an amp/volt. We made sure we always turned the current low when we first switched the power pack, as not to melt the wire and burn ourselves. We conducted the experiment with a consistent level of accuracy i.e. we always waited until the reading displayed by the voltmeter was stationary before we recorded it.
I think we have sufficient evidence to support our conclusion for this experiment, as shown by the clear positive correlation of the graph line, against the line of best fit. Also we had no anomalies within our evidence, therefore all our findings supported our conclusion-as proved by the graph at 40cm the resistance is at 4.10 Ω, and at double this length, at 80 cms, the resistance is at 8.15 (nearly double as 4.10Ω*2= 8.20Ω-this also proves that our graph is directly proportional. However we cannot be sure that this trend is indefinite, and we cannot be certain that this trend will continue, whether the resistance will always be directly proportional to the length of a wire by a factor of 2; unless we conduct another experiment to prove this theory.
We could use exactly the same procedure and wire (SWG 28 nichrome) as this experiment, however we could use a wider range of wire lengths, till 10m, over intervals of 50 cms. This means that we will be conducting the experiment with a far wider range of wire lengths, to see whether the results we obtain follow our original experiment’s line of best fit. The controlled variable within this experiment will be the current supplied, and we will monitor the voltage using a voltmeter, and use our findings to calculate the resistance if the length of wire. By then plotting a graph of length of wire against resistance, we will be able to see whether there is a pattern between the results, and whether they support our original conclusion.
Another experiment we could conduct is to see whether our conclusion is supported when using different wire materials. We could use the same procedure as our original experiment, but with a different key variable. In this experiment the key variable is the length of wire, as we are constantly changing it; however in a further investigation, our key variable could be types of wire. So we would keep the length, and thickness of the wire constant, however we could change the material from which the wire is made from e.g. Silver/ copper/ nichrome/ constantan etc. We could supply one given current to the length of wire, and by using a volt meter to measure voltage, we can calculate the resistance of the wire, we could then plot the resistance of the wire against the length, and then seeing whether in all materials the length of the wire is still directly proportional to the resistance.