Work done = Energy Change = Force x Distance
½ mv = F x D
Combining work and stopping distance can be shown as
D = MV
2F , which can be re written as;
(1/2 x M/F) x V
The stopping distance (d) is proportional to the square of speed (v ) (where ½ x M is constant.) F
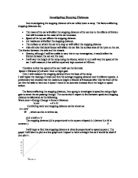
I will hope to find that stopping distance is directly proportional to speed squared. The graph I will want to plot is a line graph and I expect to have a straight line as it would be ideal if you plot v .
To see if braking distance is proportional to speed and we’ll have to use the Highway Code to prove it. As the braking distance increases more and more rapidly as the car’s speed increases. The values for 20mph and 40mph, the braking distances are 6m and 24m. Doubling the speed gives four times the breaking distance. Summarily trebling the speed, from 20mph to 60mpj gives nine times the breaking distance. This gives a curved graph. This is what we expect from one of the equations of motion: v = u + 2as. The final speed v=0. Rearranging gives us s= -u /2a, which shows that the distance s is proportional to the square of the initial speed, u . During this the energy change of kinetic to heat, was the result of fiction between the tires and the surface.
To construct the investigation we used set up a light gate system with a psion computer to th3e base of the ramp, as the car will be allowed to pass through it. The car would have a piece of card to attach it so the light gate would be able to sense this change. The speed could be changed by the height of the ramp.
The measurements will be speed in m/s whilst the distance was in cm. The preliminary results were a basis of the range I was going to use. We decided from this we would use the smallest height of 10cm, 15cm, 20cm, 25cm, 30cm, 35cm, 40cm and to the largest height of 45cm. We will repeat each height 3 times and will have two solutions speed – required from the Psion and distance – measured from the ruler as soon as it left the base.
Results
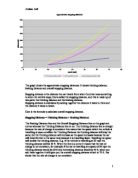
Conclusion
From the results that I have got I have found my predictions to be quite good, as the lines on the graphs are similar to what I predicted. On the graph there was a linear line, which does not pass through the origin, therefore a procedure in the apparatus was incorrect.
If I were to redo this experiment I would make several changes. Below is a list of the factors causing problems and proposed solutions.
- The car losing speed while going down the ramp.(Use a car that loses less friction at moving parts such as axles and make a more streamlined car.)
- The sudden change in direction at the bottom of the ramp.
- The car bumping about. (Use a car that is slightly heavier to make anomalies due to rough terrain less noticeable.)
- Make a ramp that is curved.
Evaluation
The method could be improved considerably because there is too much room for error when conducting the experiment. Although the results were fairly reliable and gave reasonable graphs there could be areas that could be improved within the method. A fault that could have been caused by an inaccuracy when doing the experiment;
- This could have been caused by accidentally pushing the toy car when letting it go down the ramp.
- Or also the car might of passed through the light gate at a slight angle and therefore increased the value for the distance, this would of caused an error.
The method used was fairly reliable as I used a light gate to measure the speed, which is much more accurate than other methods, which would involve manual timing.
But also there are a lot of things that could be improved for example-using blocks to support the ramp could have caused an error because they might not have been exactly 10mm thick, therefore causing an inaccurate increase in height. This would probably not of showed up in the results, also the positioning of the ramp was often moved this could have altered the angle o the ramp that could of caused error. One of the most obvious changes, which could be improved, is the release of the car down the ramp this was done by hand which would have caused inconsistencies in results. Another part of the method that needs to be improved is the act of measuring the stopped distance of the car. This also was done by hand which could cause significant error because of the inaccuracies involved with looking down at the ruler and reading off a value. To improve the point made about releasing the car I would set up some sort of clamp with a solenoid to release the car electronically therefore eliminating any human error.
Also stopping distance could be measured electronically by using several hundred tiny lasers or light gates set up in millimetre intervals, just like a ruler along the area where the car would run. Or there could be tiny magnets set up along the ruler and a reed switch attached to the side of the car and as it passed along side the ruler depending on how many times the reed switch was broken it would calculate a distance. Then a measurement could be digitally read of a display, which would eliminate any human error in looking at a ruler. But these ideas are far too unpractical to do at school and would be very time consuming to set-up. Also to improve on the height adjustment of the ramp could be done using pneumatic pistons to lift the ramp up and down to the exact height wanted.