5 pipettes
A small amount of water
A measuring cylinder
A stop-clock
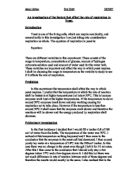
I will set the experiment up as shown:
Method: I will set up the apparatus as shown. With water in one test tube and the other one containing 25ml of the yeast and glucose solution, also the water bath will be set at 37 C and I will start the stop-clock as soon as the first Carbon Dioxide bubble comes through. I will then count the amount of bubbles that I see in that minute and will record them. Then I will count them for the next minute from 0 again. I will get 10 results for each different experiment I do, I will do 5 experiments – the yeast concentration will go up by 0.5g in each one, starting at 0g and ending with 2g. At the end I plan to have 50 results in a result table and plot a graph of the average amount of bubbles for each different concentration.
Prediction: I predict that the higher the concentration of yeast the more Carbon Dioxide bubbles there will be per minute. The more yeast you have the more active sites there are therefore there should be a lot more collisions giving off Carbon Dioxide bubbles.
Also I expect that if you double the yeast concentration, the amount of CO bubbles will double as well. In my graph I predict there will be a strong positive correlation and that it will have a straight and steep line of best fit.
Results: Here is the table of results from my experiment.
The anomalies are highlighted in red.
Analysis: In analysis I think my experiment went very well. There were no major errors and it went almost exactly as I stated in my method.
My graph is quite like I expected, it has a positive strong coloration. Also it has a pretty straight line of best fit and it is steep. I expected that if the concentration of yeast doubled then the amount of CO bubbles would double as well. They didn’t exactly, but a few of the points were only one or two away.
The investigation wasn’t completely accurate though, a colleague noticed that the diameter of the delivery tubes varied and we had two experiments using different delivery tubes. Also the size of the bubble varied, some were huge and some were small. I recommended that in the future, for measuring the amount of a gas given off we measured the displacement of water.
There were a few anomalies, most were too low and at the start of the investigation. I think that it must take a minute or two for the experiment to get going but I can’t explain the ones that were too high or in the middle.
Finally I noticed that some other colleagues were cheating and were tapping the delivery tube with stationary to increase the amount of CO bubbles.
So, overall I am very pleased with my experiments and my investigation.