Evaluation
Anomalous results
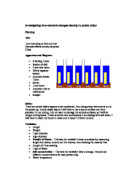
On my neat table of results I have marked several anomalous results, which are worth evaluating. The first two results I have marked using yellow highlighter are unusually high compared to the mean sag for potato chips in 1M solution, being 5.2cm and 5.0cm compared to a mean of 3.9cm. There are several conceivable reasons for these two anomalies, one of the most obvious ones being inaccurately cut potato chips. Cutting accurately 25 potato chips is a difficult job and there was significant variation in the shape and size of the potato chips, this would undoubtedly lead to inaccuracies in the results, so these two anomalies may well be the result of chips that have been cut too thin. Another possible reason for these anomalies is errors when making up the sucrose solutions, this could lead to a solution with a molarity higher than it should be; this is another possible reason for these two anomalies, since if the potato chips were placed in a solution with a higher molarity then the water potential imbalance would be greater and more water would move from the potato cells to the solution, leaving the chip more flaccid and saggy. The next anomalous result, highlighted in pink, is far below the average of 3.1, being only 1.1, this could also be due to a number of reasons. One possible explanation is incorrect timing of the experiment; obviously, if the potato chips were removed from their solution of sucrose before the correct time span of 40 minutes had passed then they would have had less chance to lose or gain water through osmosis, and they would be stiffer than other chips left in for the correct time, this may be the reason for this anomaly. The next anomalous result, marked in red pen, is far above the average for the 0.5 column, which is only 1.8, whereas this anomalous result has a value of 4.4. Once again there are a number of possible reasons for this unexpectedly high value. One serious possible cause being the measuring technique used, which was far from accurate. Trying to measure the sag using a ruler when the strip of potato was swinging around was very difficult and would have led to some inaccuracy. Since this is a table of class results this anomaly may be down to this individuals measuring technique, different measuring techniques may well be a source of much variation in the results.
Sources of error
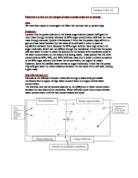
There are many possible errors that could of occurred in this experiment due to a method that was far prom perfect. Below is a list of the possible errors that could have occurred and how they would affect the results.
- Chip size – chips will sag too much if cut too thin or won’t sag enough if cut too thick – will give too high or low results.
- Solution concentration errors – inaccurately made up solutions will draw an unfairly large amount water from the potato chips if too strong and will draw too little water from the chips if too weak, this, obviously, will have an adverse effect on the accuracy of the results.
- Timing – in this experiment each chip must be left soaking in solution for forty minutes, if a chip is left for too long or short a time then an unfairly large or small amount of osmosis will have occurred, this will have a significant effect on the fairness and accuracy of the results.
- Measuring – since the measuring technique was poor many errors may have occurred here, this would have effected the accuracy of the final results.
All of these errors are potentially very detrimental to the results of the experiment, and could seriously affect their accuracy. The source of error which I believe had the biggest effect on the results of the class was the chip size, since we were all required to cut 25 accurate potato chips within a fairly short space of time there were many errors, resulting in chips that were too thin or thick and therefore too stiff or too bendy. Since the chips to be cut were fairly small any error in the cutting could have a significant effect on the results. Since everyone in the class is a fairly competent biologist capable of measuring glucose and clicking a stop watch, I doubt that the potential errors of solution concentration and timing had much effect on the results. However, the measuring technique could well have led to errors, which had a detrimental effect on the results. The chip swayed around a lot when measuring the sag and it was difficult to measure accurately, different people could well have used slightly different techniques to measure the sag, resulting in differences in the results.
The technique used in this experiment was suitable for measuring the level of osmosis in potato chips and the results obtained back this statement up. However, several improvements could be made to this experiment. Firstly, a system to accurately cut chips of the same size and shape could be developed, a chip cutter of the type sold in cooking shops would be perfect for this job. This would eliminate errors due to different sized chips and improve the accuracy of the results. A different measuring technique would also help improve the results. Instead of measuring the sag of chips due to osmosis, the length change of potato chips due to osmosis could be measured. This would be much easier to measure and therefore would improve the accuracy of the results. One other improvement that could be made to the experiment would be to increase the number of repeats, this would improve the accuracy of the overall averages.
Despite the high standard deviation values of the results I feel that they accurate enough to support a firm conclusion. The fairly high number of repeats should have helped to smooth out the anomalies found in the data. The trend shown is what I was expecting to see, and this helps to show that the results were fairly accurate. Despite the potential errors and anomalies I have outlined, the graph produced from the data is good enough to support my conclusion.