Method: Firstly, having chosen the concentration as the input variable, the other possible variable must be kept constant to ensure that the results are caused by the concentration and nothing else. To make sure we keep the temperature constant, we will leave the potato pieces in the same environment and under the same conditions (i.e. in/out of direct sunlight). The pressure will be kept the same under these conditions as well. To ensure that the surface area remains the same, we will use the same size and shape potato chunks. Taking the chunks from the same potato will make sure, to an extent, that the nature of the membrane is the same in all the ‘samples’.
Using a potato corer, a long ‘cylinder’ of potato was taken from a potato and divided into 15 equal pieces using a scalpel, of similar size and shape. These were then divided into 5 separate groups, one group for each different solution used (i.e. groups of three). They were then labelled, for identification purposes, and their masses recorded using electronic scales. Five different solutions were used: 0M, 0.2M, 0.4M, 0.6M, 0.8M and 1M sucrose solution.
At the start of the experiment, the first set of potato chunks was placed into the 0M solution. Then, three minutes later, the next set of chunks was placed into the 0.2M sucrose solution. This continued every three minutes for all the potato chunk sets until all were placed into their corresponding solution. Once all this had been done, the time taken was 12 minutes. Therefore, on 15 minutes, the first set of potato pieces was removed from the solution, dried with paper towels, and re-weighed using the same set of scales as before. The chunks were then placed back into the solution. Three minutes later, the next set of chunks was removed, dried to the same extent as the first set and weighed then replaced. This continued every three minutes as well, returning to the first set again after all the sets had been re-weighed. At the end of the experiment, this gave us 4 separate readings for each potato chunk in each solution, taken at regular intervals of 15 minutes from start to finish more efficiently and in a much shorter time than would’ve been taken if each set were tested separately.
In order to ensure that the experiment was a fair test, the same set of scales were used throughout, so as to make sure all the readings were constant and relative to one another (as another set of scales may have been calibrated slightly differently). Also, all the potato chunks were dried to the same extent to guard against too much excess water being present, but also to ensure that that water wasn’t ‘sucked’ from the potato itself. Even if this was happening, drying to the same extent made sure that the same thing happened to all the other chunks too. These ‘possible errors’ were discovered in a previous experiment done in class, therefore allowing modifications in the method to be made to get fair and true results.
To increase the accuracy of the experiment, the weight of the potato chunks was recorded at regular intervals and three chunks were used in each solution, therefore giving a larger set of results and allowing any anomalous results to be made obvious when compared to the other results for that particular potato piece or molarity.
A range of molarities of solution was used, as this enabled, not only an opportunity to see the general trend of the rate of osmosis in potato cells in different strength solutions, but also allowed us to get a rough estimate of the actual molarity of sucrose within a potato tuber cell, thus fulfilling our aims.
From a secondary source, it was seen that in a similar experiment to ours, when the potato was placed into different solutions,
‘the molarity of sucrose [solution] causing no change in mass is 0.27.’
M.B.V. Roberts–‘Biology, A Functional Approach’
This, therefore, indicates that since there was no change in mass, that the molarity of sucrose solution within a potato tuber cell is also 0.27M.
The results taken from the experiment were then converted into the percentage change in mass for each potato chunk.
(Final mass – Initial mass) × 100 = Percentage Change
Initial Mass
This was done as even though they were all of similar shape and size, there are always bound to be slight inaccuracies, therefore, the percentage change tells us how a potato chunk of similar shape, but of any mass would react. It also allows us to compare that potato chunk with other potato chunks fairly.
Finally, the percentage change was then converted into a rate (Percentage Change / time) so that we could see the rate of osmosis for each potato chunk and still be able to compare it with the other results.
Apparatus: Potato
Potato Corer
Scalpel
5 Petri Dishes
0M
0.2M
0.4M
0.6M
0.8M
1M
Electronic Scales
Paper Towels
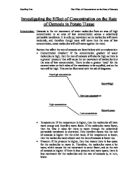
Prediction: I believe that any potato chunks left in a sucrose solution of lower than 0.27M (see secondary source) will gain mass as they will have a lower concentration of water molecules in them than in the solution surrounding them. Therefore, the net movement of water molecules will be into the chunks via osmosis, in an attempt to even up the concentration of the inside and outside of the potato, since sucrose molecules cannot pass through the selectively permeable membrane. On the other hand, I believe that any solutions the potato chunks are immersed in above 0.27M will cause their mass to decrease. This is because the concentration of water molecules is greater inside the potato, thus causing the net movement of water molecules out of the potato and into the solution, causing a decrease in the mass of the pieces.
Also, I think that the further the sucrose solution that the potato is immersed in is from 0.27M, the greater the rate of osmosis, whether it be into or out of the chunks. This is because when there is a much larger concentration gradient between two solutions, there is a greater need for the two solution concentrations to be equalled, therefore the rate is higher.
Finally, I believe that, based on research from secondary sources as mentioned earlier, the strength of sucrose solution within a potato cell is 0.27M, therefore if a potato chunk was immersed into this solution, there would be no change in mass.
Results: The results of the experiment are shown in the form of a table on separate sheets after this page.
From these results, we can create another table, showing the average rate of percentage mass change for each molarity of solution. On occasion, some results have been omitted due to obvious anomalies.
From this table, we can then create a graph to show the rate of percentage mass change per minute against the molarity of the solution.
Also, for each of the solutions, we can create a graph depicting the percentage mass changes over time; this graph is shown overleaf. All of the anomalies have been highlighted and will be explained later.
Conclusion: The first graph shows that the point at which the mass change is ISOTONIC (or stationary) is roughly 0.3M, which supports the hypothesis based on the secondary source that the sucrose concentration within a potato tuber cell is 0.27M. On this graph, we can also see that when the solution is below 0.27M, there is a positive movement into the cell, this is known as being HYPERTONIC. When, on the other hand, the solution is above 0.27M, the overall mass movement is out of the potato (causing it to lose weight); this is called being HYPOTONIC.
We can also see from this graph that the results towards the higher molarity sucrose solutions used seemed to start levelling off. This suggests that there is in fact a maximum rate of osmosis in potato cells, probably due to the fact that there is only a limited amount of water molecules that can pass through the selectively permeable membrane over a set period of time. This would therefore mean that on much stronger solutions, even though the concentration gradient is larger, the rate could be similar to lower or higher solutions above a certain point.
From the second graph, we can see from the trendlines that for a few of the molarities that are nearer to 0.3M seem to begin levelling off, therefore reinforcing the view that the molarity of sucrose solution inside a potato is around 0.3M, and also that once the molarity of solution inside and outside the potato is equal, there will be no further osmosis. This could be true as once the solutions have equal concentration, there would be no need for osmosis to take place, or indeed, anything to cause it to take place.
Errors: There were many anomalies in the experiment, as indicated by the highlighted values in the graphs. These may have been caused by a variety of different factors. These are listed and explained below.
- Limitations and Availability of Equipment
Since the equipment being used may not have shown readings into great detail (e.g. the scales only gave mass to 2 decimal places), we cannot have 100% accurate results in the first place. Also, due to low availability of equipment (e.g. sets of scales had to be shared by 2-3 groups), it wasn’t always possible to measure the masses of the potato pieces exactly on time, as planned.
- Drying each Potato Equally/Sufficiently
Due to human error, and also the availability of the equipment, it was impossible to ensure that every single potato chunk was dried absolutely equally. Also, even if each of the potato pieces were dried equally, there was no way of knowing exactly how long they should’ve been dried for to get rid of excess water on the surface, but to ensure none was taken from inside the potato cells. This may have caused results to be too high or too low.
If the potatoes used were not that big, then it meant that you had to use a second potato to have enough pieces. This may have caused a difference in the nature of the potato tissue, which could’ve affected to results, as explained in the introduction. Also, the nature of the tissue may have differed from where the cells were taken from (i.e. from the edge of the potato or from the centre).
Since the cutting of the potatoes was done by hand, there was a possibility for human error in the shape, which could have therefore resulted in some pieces having different shapes and thus different surface areas, which could affect the results as mentioned in the introduction.
If different amounts of solution were used in the petri dishes, then the entire chunk may not have been covered, whereas in other dishes it may have, exposing a larger surface area to the solution, affecting the rates of osmosis. Also, if the potato wasn’t completely covered, it may have resulted in the loss of mass due to evaporation into the air.
Improvements: To improve the experiment, we could prevent the anomalies occurring by ensuring that each chunk is dried for an equal amount of time on both sides, and then taken off the paper and placed onto a non-absorbent surface to prevent any further moisture being lost. While this may not solve the problem of the amount of water being dried off, it will ensure that all the readings after the initial ones are all relative to each other.
We could also make sure that all the potatoes are of sufficient size, thus preventing the issue of tissue nature being a factor. This may, in turn, allow all the chunks to be taken from the same area (e.g. the middle) of the potato, again ensuring the cells are of the same nature. On the issue of size and shape, if such equipment were available to us, we could use much more accurate (or even machines) equipment to measure and cut the pieces.
We could also make improvements to the experiment by ensuring that an equal amount of solution is placed into the petri dishes, allowing the entire potato piece to be submersed in it.
In order to EXTEND the experiment further, a much larger range of solutions could be used in the investigation in order to explore whether or not there is an actual maximum rate, and what it is. In addition to this, to try and find a more exact value for the molarity of sucrose inside potato cells, we could conduct the investigation, concentrating mainly on the molarities of value 0.2-0.3M.
Finally, the experiment could be conducted over a much longer period of time, allowing us to find more results, making it easier to see the trends and to isolate anomalies.