Here is a diagram:
-
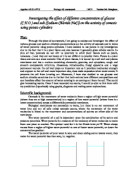
Net movement of water is into cell. The vacuole swells. The vacuole and cytoplasm push against the cell wall. The cell is turgid (swollen).
-
Water molecules move into and out of the cell in equal amounts. The cell stays the same.
-
Net movement of water is out of the cell. The cell is flaccid (soft). The cytoplasm shrinks and the membrane pulls away from the cell wall. This is called plasmolysis.
A cell does not burst due to the presence of the cell wall.
Hypothesis:
In my opinion, many statements would be proved through this experiment. First of all, I believe that the greater the concentration of the solution (whether it is glucose or sodium chloride) is the smaller the mass and size of the potato chip at the end of the experiment would be. I also expect that as the concentration of both solutions increase, the volume of the external solution will increase as well. This is due to the fact that osmosis is the movement of water molecules from a solution where they are a lot to a solution where they are few through a semi-permeable membrane until they are evenly spread. Therefore, like in this particular example, the concentration of the external solution (glucose or salt) is high which means they do not have many water molecules, the water within the potato chips will go out and move into the external solution. This will make also make the potato chip to swell up and to become turgid. In the same way, if the external solution contains more water molecules than in the potato chip, then we would assist to a net movement of water molecules from the external solution to the potato chip. This would result in a gain of mass of the potato chip, the length also would increase and the potato chip would become flaccid. The volume of the external solution would decrease due to the low concentration of water molecules.
It is also predicted that the isotonic solutions, for both length and mass to remain unchanged, to be of the same molarity.
I do not expect the potato core to burst as it is protected by an inward cell wall (made of cellulose) which cannot expand a certain point.
Besides that, I am expecting that osmosis would have a better impact on the potato chip when the external solution is sodium chloride than if it would have been glucose.
Each mole of NaCl dissociates into one mole of Na and one mole od Cl . so there are 2 moles of solute entities per mole of NaCl dissolved. 0.5M NaCl has the osmotic strength of 0.5M x 2 = 1.0M solution (of glucose for example). Each ion interacts with water – each has a ‘hydration shell’ so each effectively decreases the concentration of free, diffusable H O molecule.
Method for pilot:
I will take two potatoes and will make few potatoes cylinders using a cork borer (which has a diameter of 10mm). I will cut each potato cylinder into potato chips of 10mm length. Then, I will weigh them and record their mass into a result’s table. I will then place each potato chip into a boiling tube. As I will make about 6 potato chips, I will need 6 boiling tubes. I will need to label each boiling tube with the concentration and name of the solution and perhaps the mass of the potato chip inside the solution. I will dilute the 2M glucose solution into 1M and 0.5M using table 3. I will also dilute the 2M NaCl solution into 1M and 0.5M. I will also add another test-tube containing one potato chip whose solution would be pure distilled water. I will leave them for 3 days. Each boiling tube contains 20mL of solution and a potato chip. After 3 days, I will take out each potato disc and blot them with paper towel to remove any excess of water. I will then record their mass using a digital balance and will measure them with a ruler. I will then record the results into a result’ s table including the mass change using a calculator.
Choice of apparatus
I have chosen to use a cork borer as it will ensure the uniformity of size of chip and increase the accuracy of the results obtained. I also intend to use measuring cylinders of 10ml as it will be more accurate to measure the solution and to have a better reading.
I will also have a ruler calibrated in millimeters in order to have a precise reading.
I have also chosen to use an electronic balance whose reading is in grams and at two decimal places.
I have chosen to use distilled water to dilute glucose and salt concentration, as it would produce me accurate results. Indeed distilled water is deionised water and therefore it would not have an effect in the final results.
I will also use forceps to enable potato chips to be held securely without skin contact, increasing accuracy of results.
I would prefer to use a scalpel instead of a knife as it can remove very thin slivers of potato, making the length more precise and the surface uniform.
I will also prefer to use 2 beakers (one for the glucose solution, one for the salt solution) in order to transfer the solutions into a measuring cylinders.
Indeed, it is difficult to transfer sucrose or water, using syringes, from a conical flash.
Using beakers reduces the risk of spillage or heating glassware while transferring solutions to measuring cylinders.
I also have decided to use a white tile in order to provide hard surface onto which the potato cylinder can be cut and is a suitable background to observe variations in the tissue. I have also chosen to use a marker pen in order to label the boiling tubes and not label-sticks, as they are time-consuming.
Finally, I will cover the boiling tubes with stoppers, as they are more affective than cling film.
Results’ table of my preliminary experiment:
I made two results’ table. The first one show the results obtained when the external solution is glucose while the second one show the results obtained when the external solution is sodium chloride.
- The solution used is glucose
- The solution used is sodium chloride
My results seem to be pretty good even though I did not repeat them. Indeed, we can see that the change in mass of the potato chip increases in negative values as the concentration of the solution increases. I can also observe that the length and diameter of the potato chips did vary and that is why I intend to add a column of change in length and diameter in my new results’ table. The apparatus that I used seemed to be fine.
Method for the practical
- I will collect the apparatus.
- I will create potato cylinders using a cork borer.
- I will then cut potato cylinders using a scalper into 2 potato chip which will each be of 10mm length.
- I will weigh each potato chip, record them into the result’s table and place them into the boiling tubes. I will make sure that before reading out the mass of the potato chip, I’ll press on the “TARE” button.
- I will label each boiling tubes and decide which solution and concentration should go in.
-
I will add in 5 boiling tubes, 20 ml of glucose solution, using measuring cylinders. The 1st boiling tube will have a concentration of 2 M, the 2nd of 1M, the 3rd of 0.5, the 4th of 0.25M and the 5th of 0.1M.
- I will repeat step 6 for salt (sodium chlorine) solution.
- I will then cover those boiling tubes with stoppers.
- I will repeat step 2-8, two times more.
- I will then leave these boiling tubes for 72 hours in order allow osmosis to occur.
- After this while, I will measure the solution present in each boiling tubes in order to notice any change using small measuring cylinders in order to be aware of any changes even if they are tiny!
- After measuring them, I will pour out those solutions and blot the potato chips one by one with towel paper.
- I will record the physical condition of the potato chip (whether it is flaccid or turgid) as it can help me to prove that osmosis did occur.
- I will then record the mass of each potato chip at 2d.p and measure their diameter and length.
- I will then record the results in the table.
- I will finally work out the mass change but also the length, and diameter, volume change and work out the average of mass.
List of my apparatus:
- 2 potatoes
- 100mL of glucose solution
- 100mL of distilled water
- 100mL of sodium chloride solution
- 12 boiling tubes
- 2 measuring cylinders (10cm )
- 2 measuring cylinders (25 cm )
- 2 syringes (5 cm )
- thermometer
- marker pen
- 12 stoppers
- scalpel
- 1 forceps
- a cork borer (10mm of diameter0]
- a digital balance (2 d.p)
- paper towel
- 3 beakers
- white tile
- ruler (must provide my own)
- calculator
- 3 test-tube racks
- results’ table
Fair testing:
In this experiment, I will try my best to make sure that it is made under fair testing.
Indeed, I will evenly cut the potato chips, making them having the same length and diameter in order to allow for uniformity. I will also keep the same temperature. This is because by increasing temperature one is increasing the kinetic energy of the molecules and as a result the diffusion rate will also increase.
I will also use the same volume for each solution 9glucose and salt) and for every concentration in order to allow for consistency.
I will use the same apparatus and create the potato chip from a similar potato. I will cover each boiling tube with a stopper to avoid evaporation.
I will also make sure that all the potato chips are fully covered by the solution in the boiling tubes in order to get significant results.
To make sure that my readings are accurate, I will use a very sensitive balance and be certain that the balance reading is at zero with the petri dish on.
When I will pour out solutions in the measuring cylinders, I will read the measurements by looking at the bottom of the meniscus.
I will also leave all the boiling tubes for 72 hours. The time has to be kept constant as different times of exposure to the sodium chloride solution will result indifferent amounts of osmosis taking place.
Finally, the potato chips will only be handled with forceps in order to minimise contrast with the cell surface membranes.
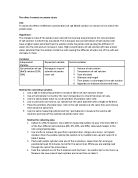
Control and the Key Variables
Independent variables
- concentration of glucose solution
- concentration of sodium chloride solution
Dependent variable
Invariables (the factors that are going to be kept the same during the whole experiment)
- Light intensity
- Pressure
- Size and thickness of potato
- Time
I decided to keep the above factors (invariables) the same for the whole experiment in order to keep the test fair and to get accurate results. The mass of the potato chips however cannot be kept the same all of them do not contain the same amount of water molecules and/or other substances. It would therefore be impossible to make them having the same mass without modifying their length. Changing their length and diameter would make the test unfair. The concentrations of solution would be varied as the investigation is based on it.
Risk assessment:
- Care must be taken in the handling of all glassware and of broken glass
- Goggles must be worn when pouring out solutions.
- Be careful when using scalpel to avoid any injury such as cutting hands.
- Care must be taken when using cork borer as considerable force is needed to cut the chips.
- Rolling up my sleeves in order to handle easily any apparatus.
- No contact between hair and substance in order to avoid any contamination.
-
Cleaning and wiping of the table each time glucose and/or sodium chloride solutions split up on my desk in order to make it tidy and to avoid any contamination.
Implementing
During this experiment, I made sure that all my measurement were accurate and made them to a degree of position as high as I could. Indeed, I used small measuring cylinders (calibrated to 1 d.p). I also used an electronic balance whose reading is at 2 d.p. I had also used pipettes when I had to add a small amount of water or glucose/sodium chloride solution into the measuring cylinders in order to be really precise.
I am now going to record my results in appropriate tables. Since I repeated my experiment three times for each solution, I will end up with 2 tables and each contains three different results for each concentration. Repetition enables me to produce averages and also to slip over my mistakes or errors.
To calculate the average of the volume at the end of the experiment, I add up the three results obtained and then divide the sum by 3. However, if one of the result is anomalous, I do not include it to calculate the average as it would make it wrong.
Moreover, to calculate the percentage average of change in mass, I will use that formula:
Average initial mass X 100
Average final mass
Analysis of result’s table
Through my results’ table, I can notice that few results are odd. In the results’ table whose concentration used is glucose solution, three main results are anomalous. Indeed, I noticed that when the concentration of glucose is 0.10M, one result shows that the change in mass is negative and minimal (0.01) while the others for that same concentration are positive and high (0.070 compared to the other one. Besides that, when the concentration is 0.25M, one result proved to be a negative and low number (-0.02) while it should be a positive and pretty high number. It stands out form the others ones.
Furthermore, we can also encounter anomalies at the volume of the solution at the end of the experiment when the concentration is 2.00m. Indeed, it would be logical for the volume to be higher than the other one when its change in mass is higher (in the table, when change in mass =-0.16; volume: 21ml and when change in mass: -12, volume: 24.2ml).
In the results’table whose concentration used in sodium chloride, we only meet two main anomalous results. Indeed, when the concentration is 0.25m, one of the result describing the change in a mass (+0.20) is for too high (against –0.12, -0.10). Moreover, a similar phenomena occurs when the concentration is 2.00m except that this time, the change in mass is too low (0.07).
I will now be displaying my results in a form of 2 graphs:
-Line graph showing the effect of variation of glucose and sodium chloride concentrations in moles on the percentage change in mass of potato chips.
-Line graph (with error bars) showing the effect of variation of glucose and sodium chloride concentrations in moles on the percentage change in mass of potato chips.
Describing the graph and relate it to any biological background:
By analysing the line graph, I can notice many differences and similarities between the trends that glucose and sodium chloride’s graphs are displaying.
To start by the similarities, both line graphs slope downwards and do not go through the origin, this implies that the percentage average gain/ loss in mass and molarity are not proportional. Nevertheless, I can still denotate that there is a strong pattern in both curves. Indeed, as the molarity of the solutions increases, the percentage average change in mass decreases. This is due to the fact that as the molarity increases, the external solution is becoming hypertonic and involves a net movement of water molecules from the potato cell (vacuole) into the external solution. The process of osmosis tries to make the number of molecules as similar in both the external (glucose/sodium chloride) and internal (potato tissues) solutions. As the graphs are curves, this means that the gradient does not stay the same. It gets less steep as the molarity of the solution gets bigger. This is because the potato chip is becoming as flaccid as it possibly can, and so the value of change in mass are getting closer and closer to each other as the molarity gets really high. Indeed, when the solution is glucose and the molarity is 1M, the value of % change in mass is –25.7% and is of –27.6% when the molarity of glucose is 2M. As I can see, the values are very close. The same phenomena appears when the solution is sodium chloride. Indeed, when its concentration is 1M, the value of % change in mass is –27.8% and turns into –28.2% when the concentration is 2M.
Moreover, I can also point out that the values of % change in mass for both solutions get very close to each other as the concentration increases. Indeed, when the concentration of both solutions is 2M, the difference between the value of % average change in mass of glucose and of sodium chloride is only 0.6%. This is due to the fact that it becomes more and more difficult for the water molecules to move out of the potato cell as the cytoplasm shrinks and as the membrane is pulled away from the cell wall. After a certain point, the cell is said to have been plasmolysed (when the cytoplasm does not contain enough water and therefore contracts and detaches from the cell wall). The pressure potential is therefore higher than the water potential in the cell.
I can also observe differences between both trends. Indeed, there is a greater % change in mass of potato chips when the external solution is sodium chloride than when it is glucose solution. Indeed, when the concentration is 0.5M, the value of % change in mass when the solution of glucose is of –17.5% while it is of –26.7% when the solution is NaCl. There is a great difference and this is due to the fact that there are 2 moles of solute entities per mole of NaCl dissolved. 0.5M of NaCl has the osmotic strength of a 0.5M X 2 = 1.0M solution (of glucose per example).
I can also notice that the line graph showing the effect of variation of glucose on the % change in mass of potato chips is less smooth than the line graph showing the effect of variation of sodium chloride. This is due to the fact that the values of change in mass, when the external solution is glucose are much more irregular than when the solution is NaCl.
I could also notice through the graphs, that the value of % change in mass, when the glucose concentration is 0.25M is pretty odd. Indeed, it is too high.
Evaluation:
I believe that my experiment went pretty well overall. I find it successful as my results match with my prediction.
Nevertheless, I met some anomalous results. The result’s table showing the action of osmosis on potato chips in glucose solution reveals three anomalous results. Indeed, when the molarity is 0.1M and 0.25M, the values of the change in mass are negative, thing that should not be occurring. Those anomalies might come from the fact that I did not record the mass properly at the beginning or perhaps though I used the same balance through my whole investigation, it might had gone faulty. Indeed, I believe that the balance I used was not enough accurate and stable in its readings. I also had an anomalous for the value of % average change in diameter when the concentration is 0.25M. Indeed, it is far too low! That error might have come from to the fact that I did not cut the potato chips properly at the beginning of the experiment. The size of the potato chips was likely to be inconsistent in shape as they were cut by hand using a ruler for measurements. Besides that, I also got an anomalous result of the volume of solution at the end of the experiment. The value was too small (21mL when change in mass is –0.16g). This mistake might had been done by spilling out some of the solution when transferring it into a measuring cylinder in order to pour the right amount of the solution in the test tube.
Except those anomalies, the results were reliable and significant. They enable me to draw some conclusions and to agree with my hypothesis. I had been able to prove that change in mass is greater when the external solution is sodium chloride. I had been able to notice that the process of plasmolysis do occur as the values of mass change were getting very close to each other when the concentration reached high values (1M/2M). I have also been able to see a pattern in both graphs: change in mass increases in negative value as the molarity of the solution increases. However, I had not been able to get an isotonic solution (where the external (glucose/NaCl) and internal (potato cell) solutions have the same number of water molecules leading to no movement of water molecules and therefore no change in mass. This is probably due to the fact that the molarity of my solutions were whether too high or too low for such a thing to happen.
Another way of improving my results would have been to leave the experiment running longer in order to find the saturation point (when the potato can no longer take in any more water) and dehydration point (when the potato cannot lose any more water).
To improve reliability and consistency, I would use an electronic balance whose reading is very consistent. I would also use a template of some sort to cut the potato chip in an evenly way. I would also have to try to find a new method of taking off the excess of water out of the potato chip before they are being re-measured in order to get reliable and significant results.
Finally, if I had to extend my investigation, I would be looking at the potato chips under a microscope in order to see the cells in greater details and draw some more observational results. I would also add few more concentration of glucose and sodium chloride within the range that I used for this experiment in order to get a smoother and more accurate graph and to be able to get rid of anomalous results more easily. I would also probably be repeating the whole experiment four times instead of three.