I am maintaining substrate concentration by always using only 10ml H2O2 and ensuring that the volume of the final mixture is 20ml (by adding water to the different enzyme concentrations) – this keeps the concentration constant throughout.
As pH is defined by concentration of H+ ions, and I know that there are none either evolved or used up (as hydrogen is always present in the liquid water or hydrogen peroxide molecules; and not released to the atmosphere), then there is no need for a buffer solution, as there will be no change in pH. This agrees with my pilot results, in which I added Universal indicator to the solution and noted no colour change. The advantage of not adding a buffer is that our solutions manage to avoid becoming even more dilute, which would give us slower rates of reaction.
JUSTIFICATION OF METHOD
In my method, I liquidised my potato instead of the other main option, which was to use potato discs. My reason for this is that, firstly, I can make a far bigger batch of enzyme solution. This is because I could, if I needed to, liquidise two or three potatoes, because even though they would have different concentrations from each other, I would still result with a single solution of a certain concentration, which wouldn’t change with different trials. I couldn’t, however, use discs from two potatoes, as I would be using two different concentrations between trials.
Another advantage of a liquid is that it is far easier to gain small increases in concentration – by simply gaining an extra 0.1ml in the syringe. Using discs is much harder, as half a disc actually has more than half the S.A of one disc, so the proportion increase would be much harder (in discs, the enzyme available to react is only on the surface of the potato piece).
I feel that having the enzyme in a solution in a beaker keeps the enzyme together at a constant concentration much better. With discs, the enzymic concentration may vary within the potato, and discs left on the tile prior to addition to the hydrogen peroxide may ooze and leave enzyme on the tile – not a fair test as this would provide anomalous results if compared to discs taken straight from potato to boiling tube. Finally, discs in a boiling tube may touch the side of the tube and/or each other. This would reduce the surface area where substrate could get to the enzyme (i.e. some enzyme would be lying idle). Again, inaccurate and unreliable results would be provided.
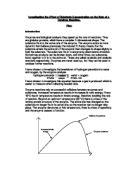
I feel that the best way to analyse the data would be graphically, where a graph similar to that in the prediction would (hopefully) be a result of the data. From this we would be able to calculate the rate of reaction [the gradient of the slope], and also calculate the point when enzyme concentration is no longer the limiting factor - i.e. for those environmental conditions, the maximum rate of reaction has been reached [the beginning of the horizontal line parallel to the x-axis].
SUITABLE EVIDENCE
To get suitable results, with a low error capacity, it is very important to do repeats. I intend to do each trial at different concentration 3 times, as this would allow any anomalies to become clear. For a range, I definitely intend to use 1, 2, 3, 4, 5 & 6 ml of enzyme, but would like to use up to 10ml, time permitting, and so long as the rate isn’t too fast for measuring.
VALIDITY
My measuring of the distance moved by the manometer fluid gives me valid results for the very simple reason that it is directly linked to the rate of reaction. Gas is evolved in the reaction process. The gas, oxygen, takes up more volume than the difference between the substrate hydrogen peroxide molecule and the water also formed. Therefore, pressure is increased within the boiling tube and the manometer fluid moves because of it. The quicker the gas is evolved, the quicker the difference in pressure is formed and so the quicker the manometer fluid moves.
In conclusion, if the fluid has moved more in one trial than another, the increase in pressure was greater, so the volume of gas released was greater and (as it was done in the same time frame) the rate of reaction must be faster, for more gas to evolved per minute.
Analysis
RESULTS
These results are after a few problems. The results above were taken during my second session of doing the experiment. The results taken during my first session were of similar values, though with only using 0.1ml, 0.2ml, 0.3 ml and 0.4ml of enzyme (i.e. at that time the enzyme was far more efficient). My time finished so I stored my enzyme solution in a fridge. When I came to use it again I found it had turned a black colour and the enzyme rate had decreased significantly. I decided to continue, but to take all of my results with the black solution for two main reasons – if I was to start again, I would only get 4 results again before the time came to stop and I would be faced with the same problem in the third session. Although the solution was a corrupt form of that used initially, the concentration of the enzyme should still be uniform throughout the solution – meaning that the same trend should be able to be gleaned from the data, and that is what I was after. Despite stating that I wanted to definitely use up to 6ml of enzyme in my planning, I was only able to use up to 4 ml of enzyme (due to the fact that the rate 5ml of enzyme would have been too fast to measure effectively). However, I was able to do trials using .5ml’s of enzyme, giving me in total, 9 good results – still a very good range.
Having drawn the graph, it is clear to see that the evidence for rate of reaction gives a very plain and obvious trend; as enzyme concentration increases, so does the rate of reaction. By working out the gradient of the graph, I can calculate the direct relationship between the rate and the enzyme concentration. As the rate has been shown by the straight line through the origin to be directly proportional to the enzyme concentration,
rate = constant * amount of enzyme added.
The gradient is this constant and I have worked it out to be 1.75. Therefore, we can say that for the batch of enzyme solution I made and used in the second lesson,
Rate of reaction (cm/min) = 1.75 * amount of enzyme added (ml).
I feel that I can now draw a firm conclusion, as I consider my results very good – they follow a firm trend with little deviation from the line of best of fit. My conclusion is that :- enzyme concentration affects the rate of reaction proportionately. This is easily explained and understood as the collision theory of molecules. To react, an enzyme molecule needs to collide with a substrate molecule. At low concentrations, there are few enzyme molecules, and these are basically in perpetual reactions – as soon as it releases the products from one reaction, it takes up another substrate molecule; the enzyme is working at its maximum rate with the majority of the substrate being untouched. I introduced more enzyme, and it began to react with more of the substrate – it was soon reacting at its maximum rate too. As the maximum rate of different molecules of the same enzyme under the same conditions is identical, the rate of reaction must increase proportionately. This is true until the added enzyme molecules don’t work at a maximum rate, due to reasons such as a low substrate concentration. If a point such as this arose during my experiment, the graph would begin to curve from the gradient towards a horizontal line. This didn’t occur, so I am afraid that I am unable to support the second part of my prediction
‘the rate of reaction will increase proportionately with enzyme concentration, but that it may reach a steady rate of reaction – i.e. an increase in enzyme concentration no longer yields an increase in rate of reaction.’
This is due to my results solely increasing proportionally the whole time, with no lessening of the rate of increase of the rate of reaction. This very fact, though, helps to add support to the first part, that the rate will increase proportionally to enzyme concentration, to the point where I would say that I am certain of it, for not only do my results agree to it, but so does my theory to explain it. Therefore, while I have no grounds to support or oppose my prediction as to how the rate of reaction is affected by enzyme concentration at very high concentrations, I can comment with almost 100% certainty as to how it is affected at lower concentrations.
Evaluation
I think that my procedure is just about as good as it could have been, with the equipment available - this is backed up by the good evidence that I obtained. I consider my results good as they follow a clear plain trend that agrees with my theory and prediction. On the graph that I have drawn, the only result that appears to be a bit away from the line of best fit is the point plotted at 2.0 ml of enzyme added. This point is 0.7ml away from the line of best of fit. As it follows the trend though (in being between the results for 1.5 and 2.5 ml added) I feel that it is more of an inaccuracy, not an anomaly, so I have kept it on the graph, but not felt forced to ensure that the line drawn through the points as best fit actually passed through it. The only actual anomaly is the third repeat of results taken at 4.0 ml of enzyme added. This result was 5cm more that the other repeats, nearly a third greater. This level of inaccuracy seemed to me to be too great, and as the other two results appeared to be in great accordance with each other, and were accurate on the graph, I simply ignored the anomaly and took the average of the two remaining good results. It seems likely to be that the anomaly was probably due to an accident from me (e.g. adding too much enzyme by mistake; misreading syringes, or my ruler when measuring) or as a result of heating the tube by placing near the radiator or similar. These are aspects where, were I to do the experiment again, extra special care would have to be taken.
Having critically considered my results, and taken into account the anomalies, I have decided that the evidence is reliable and suitable to support my conclusion. This is because there were very few anomalous trials – or trials where the results strayed from the line of best fit. In the cases that there was a slight error, it was clearly visible and so able to be avoided. Because of that, I feel that all of the other results can be considered fair as they were subject to the same conditions, and fitted together well in the graph. As there is such good correlation in the results (9 separate trials all agreeing), with none sticking out particularly, I have no reason to really doubt them as to their accuracy. Therefore, I consider them fair, and a fine base for my conclusion.
Although, I reckon that my procedure was the best that I could do, I noted a couple of problems that occurred that I would change, were I to have to do it again. The first is the way that I had to shorten the time over which each trial ran. In my pilot, 5 minutes was ample time – even when using most enzyme, but I found in this one, that after 3 minutes the manometer fluid was almost coming out of the manometer. As the pilot has been shown to be ineffective in trying to calculate the time needed, as it uses a different concentration solution to the real one, I would do a quick practice test before the real trials – just to check over what time period to run the experiment for.
I noted that on occasion, when I was tightening the clamps after fixing the bung in place, the fluid level would rise. As this could have caused inaccurate results if I hadn’t spotted the change and altered the start point for measurement accordingly, I think that were I to do it again, I would ensure that the clamps were smoothly closed – to allow the air being displaced to escape the rubber tubing as it was closed. Also as I was only using my ruler to measure the distance moved by the fluid, I think that a length of graph paper attached to the manometer would yield better results, as it would be far easier to study the distance moved, by marking on the squares, and then measuring them at a later time – rather than by having to hold a ruler up to the vertical tube.
When I went to store the solution, there were two problems. The first is that after taking it out of the fridge, one must remember to allow the enzyme to warm back up to room temperature, or all results will be void, due to having changed two variables (enzyme concentration and temperature). The other problem was the way that after going in the fridge the solution became black with reduced enzyme concentration/efficiency. I believe that it was as a result of being oxidised by the oxygen in the space between the beaker and the cling film. To try to counter this, either all of the experiment should be done at one sitting; in a longer session, rather than in two sessions two days apart, or if that cannot be done, the enzyme solution should be stored in an airtight beaker or container, filled to the very top.
I found that the manometer was useless at concentrations over 4.0 ml of enzyme. Although I could use the data already extrapolated to put it into a form which could be comparable to data obtained from a gas syringe, I am reluctant to use a gas syringe for the same reasons as mentioned in my planning. Therefore, if possible I would strive to obtain a bigger manometer with which to do the experiment, as this would allow me to work with greater concentrations of enzyme without the fluid actually leaving the manometer.
The last problem that I encountered was the way that foam was produced when I used a high concentration of enzyme. In the bubbles of the foam, the air may well be slightly higher than atmospheric pressure (to maintain the form of the bubbles) – as the distance of the manometer fluid moved relies on the equalising of the pressured inside the test-tube, this could be very important. Therefore, I would add a little surfactant to the test-tube, with the substrate (providing that it didn’t have any adverse effects on the enzyme) as this would prevent foam from forming and would solve the problem.
There are a couple of areas I would like to pursue in any further work, after more repeats to broaden the data pool, to clarify my conclusion to without a shadow of a doubt. I also think that equivalent experiments should be carried out with different enzymes acting as catalysts, like Catalase, to check whether my conclusion accounts for all such reactions, or purely for experiments with Catalase.
In my prediction, there were two parts. The first part I proved soundly, but the second part, concerning high concentration of enzyme, I was unable to comment upon. To try to rectify this, if only a very small amount of hydrogen peroxide was used, this would mean that the enzyme concentration would be increased – without the fluid leaving the manometer, as the same maximum rate would be achieved (so long as I didn’t use more than 4ml of enzyme). If I did this, I would then be able to find out if, as predicted, enzyme concentration becomes no longer the limiting factor, meaning that an increase in enzyme concentration doesn’t result in an increase in the rate of reaction.
I also think that I should investigate how the other variables affect the rate of reaction : temperature, substrate concentration, pH, pressure.
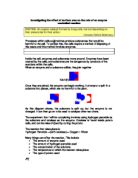
If it would be possible to lay one’s hands on one, I feel that a mass balance accurate to the nearest milligram could be very good. By setting up the following, it would be possible to calculate the mass of oxygen lost to the atmosphere, which would be directly proportional to rate of reaction, in the same way that the distance moved by the manometer fluid was. This method, should be more accurate in the measurement of the rate of each trial, and so should give more accurate results with less chance of error, inaccuracy or anomaly. Also, This experiment wouldn’t have limits on it as to the maximum or minimum enzyme concentration – as any gas leaving, however fast or slow, would all be monitored and recorded. A problem, which could occur with high concentration of enzyme being used, is that the experiment could start off very fast, but die off as substrate concentration diminished. By reading off and recording the results every 20 seconds or so, of the 5 minutes, it would be able to monitor this effect and act accordingly. A final problem could possibly be that water would be lost via evaporation too – affecting the results. This however, should be a constant value (so long as the trials are done under equal conditions), which a control test would identify.
JACK BALDWIN