In simpler words and relating it to the experiment. The higher concentrations of salt in the test tubes will draw the water that already exists within the potato out so that they are now equal concentrations.
Apparatus
- Four test tubes
- Test tube rack
- Four pieces of raw potato that are of the same mass and measurement
- Water
- Three different concentrations of salt in the different solutions of water
- Stopwatch
- Paper towel
- Four students
Method
We are grouped in fours and will each take responsibility for their piece of raw potato. They will be cut to the exact same size.
They will then be rolled in the paper towel so that any excess water will be absorbed. They are then weighed and their weight is recorded on a table. Then each student will prepare a test tube for his or her potato. Test tube A will contain 200ml of water. Test tube B will contain 200ml of a solution containing 0.25M of salt. Test tube C will contain 200ml of a solution containing 0.50M of salt. Test tube D will contain 200ml of a solution containing 1.00M of salt. When all this is prepared all four students will drop their raw potato into their test tube at the same time. The stopwatch will also be started at that same time. The potato pieces are then left in the test tubes for twenty minutes. After this they are all taken out at the same time and again rolled gently in the paper towel to absorb any excess water. The potatoes are again then weighed and their results were recorded.
The measurement I will be taking is weight (g). I have chosen grams because it will measure the weight accurately. And it is the only measurement that the scales I am using will give.
The experiment will only be carried out once because of the time given. But if allowed a total of three experiments will be carried out. This would have given a far more accurate graph because we would have taken an average of the three experiment results.
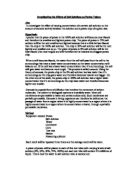
The Graph at the end of my experiment I believe will look like this:
Results
Conclusion
From my results I have found that the potato that was left in the water gained mass. Where as all the potato’s that were left in the salt solution all decreased in mass. This supports my prediction that the higher the concentration of salt in the solution the more mass that the potato will loose.
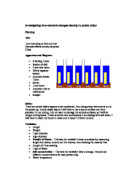
Graph
The graph gives us a clear view that the higher the salt solution the more mass is lost.
There were no anomalies (rouge results that do not fit the pattern) in the graph or results.
There is a definite relationship between the two variables; the line of best fit shows this.
Looking back at my prediction I can see that my theories and prediction were correct. The predictive graph that I drew was also close. The differences being that the proper graph had a taller angle on the line of best fit. The results support my prediction because they show how a higher concentration of salt (1.00M of salt meant 0.43g in a solution meant that the more mass that the potato lost. And the less salt in the solution the less mass lost.
Evaluation
The quality of the results I have is good. All the stages of the experiment were done accurately and well. But unfortunately there was not enough time to carry out a second or third experiment. Which I would have taken an average from, which would then give me a better and more accurate graph.
It was a fair test, all the variables were controlled and kept fair.
But there were difficulties when carrying out the experiment. When we dropped the potato into the test tubes we had to make sure we all did it at the same time. Plus we had to start the stopwatch at the same time we dropped the potatoes.
If I were to do the experiment I would use some sort of machine that dropped the potatoes into the water and start the stopwatch all at the exact same time. This would have maybe make the results slightly more accurate.