- Results/Comments on Preliminary Work:
From my preliminary work, I gained some useful experience in running this experiment. As well as having a chance to check my methodology, I learned that a few things needed to be changed in order to make the experiment run more smoothly and efficiently.
Originally, I had intended to measure results in terms of how long it took for a certain amount of carbon dioxide to be produced. I realised, however, that this would be less accurate. The bubbles took time to reach the top of the upturned burette, so it was very difficult to accurately know how much CO2 had been produced at any given point, as some bubbles were still moving up the tube. I therefore decided I would measure how much carbon dioxide was produced in a certain time
When I first planned the experiment, I intended to have 3 solutions being tested simultaneously, with the intention of saving time. I could not do this, however, due to available equipment limitations. I also realised how difficult this would be, as everything became very crowded and the results would happen too quickly, so when I do the experiment proper I will only have one reaction being timed at any one point.
When I did this the first time, I realised that I had a problem: the upturned burette was only 50 cm³ in capacity, and it had been filled with CO2 within 10 seconds. I therefore changed the concentration of acid to 1 mol/dm³, by combining equal amounts of water and 2 mol/dm³ acid, and tried again.
The second time, it was slightly more successful – the upturned burette took 20 seconds to fill completely. This was still not ideal, however, so I tried to compensate by using a measuring cylinder to measure the amount of CO2 given off rather than the burette. I found it very hard to submerge the open side of the cylinder whilst it was full without letting any air out, however, due to its large surface area. This meant that I would not be able to measure accurate results, so it could compromise the quality of my results.
I then decided to try to slow the reaction further by decreasing the amount of HCl solution from 20 ml to 10 ml. I also decided to only use 1 g of CaCO3 in the experiment, and time just 20 seconds so that the burette was unlikely to completely fill. This seemed to work, as after the timed period, I measured 28.7 cm³ of CO2 had been given off.
I will therefore use 10 ml HCl solution (1 mol/dm³,) reacting with 1 g of small CaCO3 chips in my actual experiment, timing the amount of CO2 given off in 20 seconds.
- Prediction
I predict that the higher the temperature, the higher the rate of reaction will be. This is because of particle kinetics: the more energy present, the faster the particles will move. This means that more inter-particle collisions will take place/unit of time. Because the proportion of collisions that cause a reaction is fixed, a higher number of collisions/time will mean that there is a higher rate of reaction.
- Experimental Plan
- Apparatus:
- 180 ml hydrochloric acid solution (1 mol/dm³)
-
18 g small CaCO3 chips
- Boiling tube
- Boiling tube racks
- Delivery tube
- Syringe
- Clamp stand
- Clamps
- 200 ml beaker (water bath)
- Water basin
- Water
- Stopwatch
- Bunsen Burner
- Gauze
- Tripod
- Heat Mat
- Thermometer
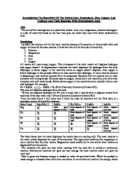
- Diagram of apparatus:
- Full method:
- Set up Bunsen burner, and heat 200 ml water in water bath to 75 °C.
- Set up the clamp stand.
- Fill water basin until it is almost full with water.
- Fill the burette with water, arrange it inside the water basin, and hold it in place with a clamp.
- Place 10 ml of HCl (1 mol/dm³) solution into a boiling tube.
- Place the HCl boiling tube in the water bath at 75 °C, and use the thermometer to find when the solution is up to temperature.
- When the HCl reaches 75 °C, take the boiling tube out of the water bath, and place into the boiling tube rack.
- Add 1.00 g calcium carbonate chips; attach the delivery tube bung to the top of the boiling tube, and the place other end of the delivery tube inside a water-filled syringe. Start the stopwatch.
- Time a period of 20 seconds, then remove the delivery tube from the burette. Wait for the remaining gas to collect at the top of the burette, and then measure the amount of gas.
- Remove and rinse out the boiling tube.
- Repeat stages iv to x for all temperatures, and ensure that each temperature has been tested 3 times.
- Range of measurements:
I decided that I would record data for yeast at 6 different temperatures:
25 °C 35 °C 45 °C 55 °C 65 °C 75 °C
I believed that these would give me a good range of results. I chose to spread my temperatures in intervals of 10 °C so that any slight inaccuracies in the HCl temperature would be less significant than if the intervals were smaller.
- Reliability of evidence:
To get reliable results from this experiment, there are a number of things which must be addressed. The most important of these is controlling all other variables which may affect the investigation. Therefore, it is of utmost importance that I hold a fair test, which can be achieved by doing the following:
- Using exactly the same amount of yeast solution in each test (10 ml).
- Using yeast solution from the same batch, in order that it has been hydrated for the same length of time and is metabolically functional, and so that the concentration of yeast in the solution is the same for all the tests.
- Taking care that the stopwatch is started and stopped at the right times, so that the 20 second period is measured accurately, and the results reflect the specified time.
- Measuring amount of carbon dioxide produced to a common degree of accuracy (1 decimal place, in cm³).
- Sufficiency of Results:
In order to ensure that I provide sufficient data to support my conclusions and proving my theory, I will aim to repeat each temperature value 3 times. This will enable me to identify any anomalous results, to get a fairly reliable average, and to therefore have a more accurate set of results.
- Safety:
2. Obtaining Evidence
- Modifications to method
Originally, I had intended to measure results in terms of how long it took for a certain amount of carbon dioxide to be produced. I realised, however, that this would be less accurate. The bubbles took time to reach the top of the upturned burette, so it was very difficult to accurately know how much CO2 had been produced at any given point, as some bubbles were still moving up the tube. I therefore decided I would measure how much carbon dioxide was produced in a certain time
When I first planned the experiment, I intended to have 3 solutions being tested simultaneously, with the intention of saving time. I could not do this, however, due to available equipment limitations. I also realised how difficult this would be, as everything became very crowded and the results would happen too quickly, so when I do the experiment proper I will only have one reaction being timed at any one point.
When I did this the first time, I realised that I had a problem: the upturned burette was only 50 cm³ in capacity, and it had been filled with CO2 within 10 seconds. I therefore changed the concentration of acid to 1m, and tried again.
The second time, it was slightly more successful – the upturned burette took 20 seconds to fill completely. This was still not ideal, however, so I tried to compensate by using a measuring cylinder to measure the amount of CO2 given off rather than the burette. I found it very hard to submerge the open side of the cylinder whilst it was full without letting any air out, however, due to its large surface area. This meant that I would not be able to measure accurate results, so it could compromise the quality of my results.
I then decided to try to slow the reaction further by decreasing the amount of HCl solution from 20 ml to 10 ml. I also decided to only use 1 g of CaCO3 in the experiment, and time just 20 seconds so that the burette was unlikely to completely fill. This seemed to work, as after the timed period, I measured 28.7 cm³ of CO2 had been given off.
I will therefore use 10 ml HCl solution (1 mol/dm³) reacting with 1g of small CaCO3 chips in my actual experiment.
- Variables
- The variable that I had control over in this experiment - the independent variable - was temperature, measured in °C with a thermometer.
- The variable that I was recording – the independent variable – was the amount of carbon dioxide produced, measured in cm³ with an upturned burette.
- There were three controlled variables in this practical. They were:
- Volume of HCl, kept constant at 10ml in each sample.
- Concentration of HCl, kept constant at 1 mol/dm³ in each sample.
- Time which the reaction was allowed to take place in – 20 seconds in each case.
- Results Table
3. Analysis
- Process Results
In order to process my results to give useful graphs, I decided that I should give a reaction rate in terms of: gas produced/ cm³/second. Originally, I had planned to give the rate of reaction in: gas produced/ cm³/minute, however I realised that as the reaction was so quick, this would give a rather meaningless value.
To work out the rate of reaction in: gas produced/ cm³/second, I had to divide every recorded value by twenty, as I had timed each reaction for twenty seconds. After completing this process using the Microsoft Excel program, I put the results into a graph.
- Graph
- Comment on Results
My results show that the greater the temperature, the higher the rate of reaction. The increase appeared to be in a linear fashion, so I included a straight trend line rather than a curved one.
- Analysis
In order to explain these results, I will refer to the theory of particle kinetics. This theory states the following:
- Brownian motion causes particles in a liquid to randomly move in different directions, due to kinetic energy.
- A reaction will occur when two reactant particles collide in a certain manner.
- The chance of two reactant particles causing a reaction when they collide is fixed.
- Therefore, in order to increase the rate at which reactions occur, it is necessary to increase the number of collisions.
- There are a number of different ways of increasing the number of particle collisions/unit time. These include:
- Having additional energy, in the form of heat.
- Increasing the concentration of reactants.
- Increasing the amount of reactants.
This tells us that we should expect the rate of reaction to increase proportionately to the temperature of the solution. Indeed, the results of my experiment show this to be true.
- Conclusions
I conclude that my results strongly support the prediction. I predicted the higher the temperature, the higher the rate of reaction; this appears to have been verified by the investigation.
4. Evaluation
- Accuracy of Observations/Measurements
All of my gas measurements were taking to one decimal place, as this was as accurate as I could be using the equipment that I had. In order to improve this, I could have used a more precise piece of equipment to measure the amount of gas given off, such as a gas syringe.
In order to ensure that the amount of CaCO3 was constant, I used an accurate top pan balance to measure the weight to two decimal places (i.e. 1.00 g). Unfortunately, however, despite trying to select chips of similar size for each practical, I had no way of measuring the surface area accurately. To improve this, I believe that it would have been better to use marble powder rather than chips – this could have limited the amount of result variation at each temperature.
The temperature of the solution – measured with a thermometer – was not constant for the twenty second periods. This was because the solution was heated to the required temperature, but then taken away from the heat source during the timing and recording. This would have allowed a slight drop in temperature as the time progressed, however, with my samples taken with 10 °C intervals, I believe that this would not have had a significant impact on my results. In order to improve the accuracy of the results, however, I could have used an incubator to keep the samples at a constant temperature.
- Anomalous Results
Although there were no blatantly anomalous results, there were a few which were rather suspect. For instance, at 75 °C, the rate of reaction varied between 1.1 and 1.9 cm3 gas produced/second. In order to find out what the true value should have been, I should have repeated the procedure at this temperature more times. However, due to time constraints, this was not possible.
- Explanation of Anomalous Results
I believe the results seemed more varied at higher temperatures for several reasons. I feel that it could have been because it was impossible to add the CaCO3 to the HCl, put the bung on the boiling tube, and start the stopwatch, all simultaneously. Resultantly, it is possible that some results may have appeared lower than otherwise expected (especially if the time I took between adding the marble, putting the bung in, and starting the timing, was inconsistent). I realise that this issue would have affected all of the results, however I think that it would have had more of an affect at the higher temperatures where the rate of reaction was much faster, as a large amount of the reaction may have already taken place before I was able to begin recording the gas given off.
At the higher temperatures, evaporation may have been an issue. Although pure water boils at 100 °C, I don’t know the boiling point of HCl in solution - HCl (aq). Regardless, more water evaporates at 75 °C than at room temperature. If more liquid was evaporating, there would have been less liquid in the solution and more condensed on the side of the boiling tube, thus the rate of reaction may have been lower.
Also, due to the varying surface area of the marble chips, the huge variation at the highest temperature might have been random and coincidental – it may simply have been that I used much larger chips for one trial, and much smaller ones for another.
- Suitability of the Method
I feel that the method I used was entirely suitable, and I can find no problems with its plan (other than those already addressed, which relate to equipment rather than methodology).
- Reliability of the Evidence
From my analysis, I feel fairly certain that my prediction has been proven to be correct. In order to obtain reliable values, however, I believe that it would be necessary to repeat this experiment more times.
Some problems may also have occurred due to the fact that I was working alone to carry out this experiment. I found that, especially at the higher temperatures, my results were varied. I feel that this could have been because it was impossible to add the CaCO3 to the HCl, put the bung on the boiling tube, and start the stopwatch, all simultaneously. Resultantly, it is possible that at the higher temperatures, where the rate of reaction was much faster, a large amount of the reaction had already taken place before I was able to begin recording the gas given off. Therefore, the results may have appeared lower than otherwise expected.
I think that the surface area of the marble chips could have been a contributor to the variation of results that I recorded. As the surface area was not fixed, despite trying to select chips of similar size for each practical, I had no way of measuring the surface area accurately. To improve this, I believe that it would have been better to use marble powder rather than chips – this could have limited the amount of result variation at each temperature. Also, repeating the practical more times would have given me a better average.
Another reason for believing that the recorded values were potentially incorrect was the fact that the temperature had not been kept constant over the period in which timing happened. This would have been more noticeable at the higher temperatures, as the rate of temperature loss from hotter items is more rapid. To correct this, an incubator or water bath would have been necessary.
After seeing such a spread in values observed at each temperature, I believe that, were I to do this experiment again, it would be necessary to repeat the testing more than three times. I think that it would be more suitable to trial the experiment five times with each heat value in order to get a larger amount of data, therefore strengthening the basis to my conclusion and giving me more accurate averages. Due to time constraints, repeating the experiment more times would have been impossible for this investigation.
- Improvements to the Method
In order to improve my method, I could use a gas syringe to measure the amount of CO2 produced by the reaction. This would allow me to measure the gas given off more accurately, perhaps increasing the precision of any graphs.
I could also use an incubator to obtain more reliable results – this would ensure that my samples stayed at the required temperature for the duration of the experiment, thus providing a more accurate set of data.
- Extension Work
In order to extend this practical, I could have used a larger range of results. I think that I could have used colder values, with the water going down to 5 ˚c and up to 95 ˚c. I also feel that I could have changed the temperature intervals from 10 ˚c to 5 ˚c in order to get more of a spread of results, and get a more accurate trend line.
Furthermore, to investigate the reaction between marble and hydrochloric acid further, I could carry out a series of other related experiments. I believe that suitable research could include changing the following variables to examine their impact on the rate of reaction:
- The concentration of HCl in the solution
- The amount of HCl solution
- The time given for each solution to react