Investigating the effect temperature has on
Investigating the effect temperature has on
Rates of reaction
Aim: My aim is to find out the effect of temperature on the rate of reaction between sodium thiosulphate and hydrochloric acid
Prediction: I think that the higher the temperature the faster the reaction will take place. This is because when heat is given to the particles, they increase in the amount of energy they have. When this happens the speed at which the move increases and they also move around a lot more.
For a reaction to happen, the reactants must first collide with each other. However, just colliding is not enough. For a reaction to take place, the reactants must collide with enough energy. This is known as activation energy. Without this energy particles will not react, they may collide but they will just bounce off each other.
The diagrams simple explain how the process works. In the unsuccessful reaction both particles collide but in doing so bounce off each other, and not combine. On the other hand, a successful collision is when the two particles join and form a new substance. If the particles hit each other more it is more likely they'll react.
There are therefore two main ways of increasing the rate of a reaction:
) increase the number of collisions
2) increase the amount of movement (kinetic) energy so that more collisions lead to a reaction
I will be testing the second variable, which is changing the amount of kinetic energy the particles have. I believe that the more kinetic energy the particles have, the faster the rate of reaction.
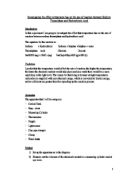
Apparatus:
* Dilute HCL (2m) for reacting with the thiosulphate and distilled water.
* Sodium thiosulphate solution (250ml)) for reacting with the hydrochloric acid.
* Conical flask 100cm3 (x1) containing the reaction.
* Stopwatch (x1) Timing the time it takes for the cross to disappear.
* Piece of card with a black cross drawn on it
* 25 cm3 measuring cylinder (x2) to measure the thiosulphate and distilled water.
* Goggles Important for safety when handling chemicals such as hydrochloric acid.
* Glass beaker
* Kettle. Heating up solution.
* Ice. Cooling down solution.
* Thermometer. Measuring the temperature of the chemicals.
Fair Test
To keep my experiment a fair test I will have to look at the variable that I'm changing and the ones I'm keeping constant. The variables that affect reaction speed for example are Surface area, Temperature, Particle movement and Concentration. My independent variable will be Temperature, so to keep the test fair and have accurate results I will have to keep the other variables constant. These are surface area, Solution particle movement and the concentration of thiosulphate, which will be 50% water and 50% thiosulphate.
I will also keep the test as fair as possible by other means. I will use distilled water to clean the conical flask after each experiment, and distilled water for the experiment. Two people will look to see when the cross disappears, and only when they agree does the timer stop. These small details help my results become more accurate, so I will have a more evidence when backing up my claims I n my analysis.
What I will vary
I will change the temperature of the solution as my variable. I will use 10 different ...
This is a preview of the whole essay
I will also keep the test as fair as possible by other means. I will use distilled water to clean the conical flask after each experiment, and distilled water for the experiment. Two people will look to see when the cross disappears, and only when they agree does the timer stop. These small details help my results become more accurate, so I will have a more evidence when backing up my claims I n my analysis.
What I will vary
I will change the temperature of the solution as my variable. I will use 10 different temperatures for my experiment these will be 10°C ,15°C ,26°C (room temperature) ,30°C ,35°C ,40°C ,45°C ,50°C ,55°C and finally 60°C.
Method
Firstly I will put my goggles on for safety, and then I will get 2 measuring cylinders and fill them up with 25mls of thiosulphate and the other one with 25mls of distilled water.
I will then pour the thiosulphate and distilled water into the conical flask, which I will place inside of the glass beaker. Next, I will put the thermometer into the solution and then fill the glass cylinder with water. The temperature of the water will vary depending on what temperature reading I want to obtain, so if I want 50 degrees I will use boiling water from the kettle mixed with some room temperature water and wait until the thermometer in the flask reads 50°C. If I want 10°C I will use room temperature water mixed with ice until I get the right temperature.
I will then pour 5mls of HCL into a measuring cylinder preferably the water cylinder
When the solution temperature is at the right temperature I will remove the conical flask from the beaker and place it onto the card with the cross labelled onto it. I will pour the HCL into the solution so the reaction will start taking place. As soon as I pour the HCL another person will start the stop watch, so the timer is not delayed. I will then observe the cross from above the flask until it disappears from my sight. I will make sure I do not disturb the reaction in any way, so the reaction speed does not get affected by other variables. I will then stop the stop clock and take down the readings. I have now got a complete result for one temperature; I will repeat this method until I have results for all the temperatures. I need to make sure that I wash out the conical flask each time with distilled water.
Results Tables
Temperature of reaction (°C)
Time taken for cross to disappear (seconds)
0
99.34
5
91.719
7.5
82.22
20
54.6
26 (Room temperature)
43.14
30
31.61
35
23.35
40
7.04
45
5.42
50
2.28
55
9.39
60
7.41
Time (seconds)
/Time
Temperature (°C)
0
*1/10 = 0.1
51
20
*1/20 = 0.05
39
30
*1/30 = 0.033
30
40
*1/40 = 0.025
25
50
*1/50 = 0.02
22
60
*1/60 = 0.0166
9
70
*1/70 = 0.0143
7
80
*1/80 = 0.0125
4.5
90
*1/90 = 0.011
3
00
*1/100 = 0.01
1
Analysis
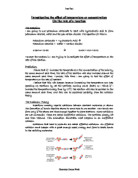
Using the experiments from my experiments I am able to point out and explain many trends within the results. For instance, I used both my results tables to draw a graph for each one. These graphs each had a line of best fit. For my first table I produced a graph showing how long it takes for a cross to disappear over a solution of sodium thiosulphate and hydrochloric acid. The graph shows an interesting and understandable trend. As the temperature increases so does the rate of reaction between the tow reactants. The rate of a reaction is the speed of the reaction. It is not "how much" of a product is made, but instead "how quickly" a reaction takes place. This can be explained using collision theory.
For a reaction to happen, the reactants must first collide with each other. However, just colliding is not enough. For a reaction to take place, the reactants must collide with enough energy. This is known as activation energy. Here is a more detailed diagram of the process:
Diagram a shows an unsuccessful collision, where nothing happens except form the particles bouncing apart. If the particles collide with less energy than the activation energy, nothing important happens. They bounce apart. You can think of the activation energy as a barrier to the reaction. Only those collisions which have energies equal to or greater than the activation energy result in a reaction.
In my experiment the results followed this rule. For instance, the time taken for the cross to disappear at 10 degrees Celsius is just over 99 seconds, while at 55 degrees Celsius it jumps up to under 10 seconds. This is a huge gap of almost 90 seconds. This agrees with the rule that the higher the temperature the more successful reactions as the particles collide more often. Likewise, a colder solution would have less successful collisions due to the lack of collisions, and therefore a lack of successful collisions. Also, to further strengthen my results, other students who conducted the experiment had the same trend as mine, and a line that curved in the same way, although they results may have varied but the general rule was the same.
However, this rule is not necessarily true, as when analysing my graph temperature against rate of reaction I found that the line of best fit curved down near the end of the graph. This indicated to me that the reaction was not increasing at a steady rate but in fact reaching a limit as higher temperatures were reached. This may be because the particles in the solution have received more than enough kinetic energy, and cannot move any faster.
Again, my results seem to follow the trend that higher temperatures result in a faster reaction, this was not as surprising as the reaction getting slower at higher temperatures. I would have expected the reaction to increase at a steady rate until the solutions would become to evaporate due to too much kinetic energy.
Evaluation
After completing my experiment I was happy to see that I had produced a good set of findings and analysis. I know I have a good set of results as the points on my graph clearly follow a certain trend. Though they may have been some slightly off findings these were only small and did not affect the curve on the graph.
These small off results may have been caused by a number of problems. It may have been due to the fact that during the experiment I was unable to keep the dilute thiosulphate and hydrochloric acid at a constant temperature while the reaction was happening. This was partly due to my method, as I did not address the concern of the temperature changing when taking the flask out the beaker of hot water, or cool ice as I believed that the change would be minimal. Unfortunately however, for the lower temperatures the change was bigger as the experiment would go on for over a minute, and the temperature could go on for up 2 to 3°C. If I was to change the experiment so that I could keep the temperature consistent I would have more reliable results. I could do this by using a more precise thermometer that can hook up to a computer, and use the Bunsen burner to heat up, or ice to cool down when needed.
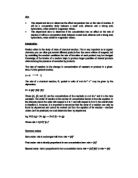
This leads me to another problem experienced during the experiment. Having to heat the solution or cool it was a long and tedious process. Unfortunately, someone would have to keep an eye on the flask so would not exceed the temperature required. This long process would have been shorter if the flask had not been made of such thick glass. Glass is a good insulator of heat which makes it hard to heat the solution through. Then again, it may have been because I used boiling water in a beaker to heat up the solution like so:
This only allowed me to reach certain temperatures, where if I had used a Bunsen burner to heat up the solution it would've been easier to keep the temperature constant, and it would have been faster. But the problem I found with going up to a higher temperature was that the reaction would become so fast would it be possible to up any higher? My second graph showed me that the reaction speed had a limit, so it would have been impractical to go very high, but if I had used higher temperatures below 90 degrees I might have been able to show how exactly the reaction speed peaks.
There were a lot of factors in the experiment that were difficult to keep constant like heat and concentration. It was difficult to keep concentration exactly the same as there would always be errors when measuring the chemicals. The measuring cylinders used are not very precise and this caused problems as the amounts of each chemical varied each experiment, and if I was to do the experiment again I would use more precise measuring utensils like burettes or pipettes.
I had to use some of this equipment as I did not have access to a more sophisticated lab. If I was to do my method again I would use recourses that were unavailable to me this time around.
Method 2:
In this experiment testing rate of reaction between thiosulphate and hydrochloric acid, temperature will be the independent variable. Firstly, I will prepare the thiosulphate by mixing it with 25ml distilled water, and then I will measure up 5ml of hydrochloric acid. I will use a Burette or pipette to measure these. I will put these in a flask facing a bulb. What will happen is that as the solution becomes cloudy the lux read by the light sensor will decrease. The test will continue for 2 minutes, and readings will be taken every second by the computer, and automatically plotted on a graph. When the 2 minutes are up the final reading will be read off to give an idea of the temperatures speed during the reaction.
The advantage of the method above is that it is a lot more accurate. Some examples of this is how readings are taken every second which will give a much clearer image of how consistent the trend may be, and eliminate the need for a line if best fit. Also, since the computer is taking the readings there is less room for human error such as missing a time or reading it wrong. Although the heating and measuring sections can have this, using a burette or pipette instead of a measuring cylinder should increase the accuracy of the measurements.
In conclusion, I am very confident that my results are clear and follow a trend that is correct for this experiment. I further back this up as others who have conducted this test seem to have a graph that shares similarities to mine. Except form 15°C and 17.5°C every point laid almost directly on the line of best fit. Even these two points were very close. The same applied for my graph showing temperature against rate of reaction, overall giving me consistent, reliable results and findings.
Suhail Patel
Page 1 of 8