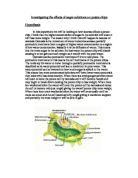
Osmosis is a special form of diffusion that involves the movement of solvent molecules. The solvent in biological systems is invariably water. Most cell membranes are permeable to water and certain solutes only. Such membranes are partially permeable. Osmosis in living organisms can therefore be defined as: the passage of water from a region where it is highly concentrated to a region where it is highly concentrated to a region where its concentration is lower, through a partially permeable membrane.
Method
Equipment needed: Potato
Salt solution
Water
Cork borer
Cork
Test tube
Beaker
Measuring cylinder
Each result will be repeated three times and the average result will be taken.
A piece of potato will be placed in each of five test tubes with varying levels of salt solution (0%, 25%, 50%, 75%, 100%) and each test tube will contain 10 millilitres of liquid. This is how the water to salt solution ratio is worked out:
100% salt solution: 0ml water, 10ml salt solution
75% salt solution: 2.5ml water, 7.5ml salt solution
50% salt solution: 5ml water, 5ml salt solution
25% salt solution: 7.5ml water, 2.5ml salt solution
0% salt solution: 10ml water, 0ml salt solution
After around 24 hours, the pieces of potato will be measured and weighed to see how they compared to their starting lengths of 4.1cm and starting weights of 1.78g. The salt solution and water will be measured to half a millilitre but the pieces of potato do not have to measured to a certain length, just as long as they are all the same length (which they are, 4.1cm). It is important to keep the measurements constant to ensure a fair test so the experiment shows fair results and it can be as accurate as possible. The only things that remain constant are the weight and length of the chips at the start and the amount of liquid in the test tubes. The only variants are the amount of water in the test tubes and the amount of salt solution in the test tubes.
The results from the experiment are shown in the following tables and two graphs (that are shown on a separate piece of graph paper.
Results
Mass of chips at start Length of chips at start
1.78 grams 4.1 centimetres
Mass of chips at end (grams)
Length of chips at end (centimetres)
The weight is measured to one hundredth of a gram and the length is measured to one twentieth of a centimetre. As you can see from the tables, the experiment has been repeated three times (to ensure a fair test) and the average result is taken to be put into the graphs. The graphs are on a separate piece of paper and the line of best fit is drawn on both of them.
Average loss/gain in mass (%)
Average loss/gain in length (%)
Conclusion
My hypothesis is correct in the way that the length of chips got bigger as the level of salt solution went down but I was sort of wrong in the way that the weight of chips goes down, then up then down again as the amount of salt solution goes up. Scientifically this is slightly wrong because the weight and length of the chips should go up as the amount of salt solution goes down. Perhaps my experiment had a few flaws in it. Because of this, I decided to investigate further into my results. On the next page are the things that could have possibly gone wrong:
∙ The ratio of salt solution to water
∙ The exact length of the chips
∙ Τhe exact weight of the chips
∙ The exact amount of time each piece of potato had in the test tubes
∙ The density of the different potatoes from which the chips were taken
As you can see in my graph the results show a slight increase in mass when the potato tuber is submerged in the solution of a higher concentration. Because of this, my results do not fully agree with my hypothesis. The results for length and mass both show anomolous results when the potato is submerged into the same concentrations of solution.
Evaluation
In my opinion, I think the experiment was equally successful as it was unsuccessful. I obtained a large quantity of accurate results from which I was able to create some detailed and informative graphs. I even think I carried out the experiment in a fair way, although the things that have could have gone wrong are listed above in the conclusion. I think I have plenty of results from which I can draw a conclusion but those results could be slightly incorrect. With some slight abnormalities in the results, you can conclude that the more salt solution there is in the test tube, the smaller and lighter the chips become because of osmosis.
Perhaps if I took some more results, say ten, and I got one freak result then it wouldn’t make much of an impression on the overall average result. This would be almost impossible to do in one lunchtime but if I was a scientist with my own laboratory I would take ten results spread over a day.
An unfair test may have occurred when weighing the potato before or after the experiment, the same could have happened when I was measuring the length of the potato tuber. Despite these possible human errors, both graphs showed the same trends and overall I think my experiment was a success.