50oC:
From these results and the averages that I calculated I noticed that at 20oC there is less CO2 given off than at 35oC or 50oC. It is actually about half the volume given off by yeast at 35oC and 50oC.
At 35oC the volume of CO2 was the greatest and at 50oC the length of the CO2 bubble dropped to an average of 50.1 mm.
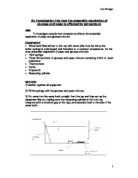
I will now draw a graph to investigate further differences, if any, between the volumes of gas given off by yeast at different temperatures.
After looking at the graph, I could clearly see that the general pattern is that the lowest rate of respiration is at 20oC and the highest rate is at 35oC. At 50oC the rate drops. The explanation of this pattern lies partially in the Kinetic Theory. It states that the rate of reaction increases as the temperature increases. This is supported by the increase of CO2 volume when the temperature was raised from 20oC to 35oC. However, it raises a question about why the volume of CO2, and hence respiration is lower at 50oC. This can be explained by the fact that all metabolic reactions including respiration are controlled by enzymes. These enzymes are proteins that have a specific shape and a specific active site to which substrates bind. Altering temperature have a great effect on the enzymes’ functions and if the temperature rises above 40oC the enzyme becomes denatured that is it will no longer function properly, because its active site’s 3D shape has been altered and specific substrates will no longer bind to it. The optimum temperature for enzyme activity is about 37oC, which shows why the rate of respiration at 35oC was the highest.
At 50oC the process of passing of hydrogen to ethanal, which releases NAD, allowing glycolysis to continue and producing ethanol stops, because the enzymes are denatured and this effectively kills the organism.
I will now attempt to carry out a statistical test to prove whether there is or is not a difference between the rates of respiration of yeast at different temperatures. I will perform a T-test to compare the rates of respiration at 20oC and 35oC, then I will compare the rate at 20oC and 50oC and finally the rate at 35oC and at 50oC. For this test I will use the results collected after the sixth readings. This ensures that the yeast was in that temperature for long enough to raise or lower its own temperature.
I will use 12 samples at each temperature
Ho: There is now difference between the rate of respiration of yeas at 20oC and 35oC any differences would due to chance
H1: The rate of respiration of yeast at 20oC is different from the rate of respiration at 35oC
The mean of the sample from the yeast at 20oC:
(31+33+35+26+27+38+40+41+32+34+36+55)/12 = 36mm
The mean of the sample from the yeast at 35oC:
(60+62+65+67+70+70+70+70+70+67+67+67)/12 = 67mm
The variance of the sample from yeast at 20oC:
(Σx2/n) – mean2 = [(961+1089+1225+676+729+1444+1600+1681+1024+1156+1296+3025)/12] – 1296 = 29.5mm
The variance of the sample from yeast at 35oC:
[(3600+3844+4225+4489+4900+4900+4900+4900+4900+4489+4489+4489)/12] – 4489 = 21.4mm
z = (mean1 – mean2)
= (36-67)/(1.57+1.34)= -31/2.91 = -10.65 (less than –1.96)
√(σ1/n1) + (σ2/n2)
At the 5% level of significance there is evidence that there is a difference between the rate of respiration of yeast at 20oC and at 35oC.
Comparing the rate at 20oC with that at 50oC:
Ho: There is now difference between the rate of respiration of yeas at 20oC and 50oC any differences would due to chance
H1: The rate of respiration of yeast at 20oC is different from the rate of respiration at 50oC
I have already worked out the mean and the variance for the rate at 20oC. The mean is 36mm and variance is 29.5mm.
The mean of the sample from the yeast at 50oC:
(70+70+62+65+68+54+59+59+6055+57+57)/12 = 61mm
The variance of the sample from yeast at 50oC:
[(4900+4900+3844+4225+4624+2916+3481+3481+3600+3025+3249+3249)/12] – 3721 = 70mm
∴z = (36 – 61)/(29.5/12) + (70/12) = -25/8.3 = -3.01 (less than –1.96)
At the 5% level of significance there is evidence that there is a difference between the rate of respiration of yeast at 20oC and at 50oC.
Now I will attempt to find out if there is any difference between the rate at 35oC and 50oC.
Ho: There is now difference between the rate of respiration of yeas at 35oC and 50oC any differences would due to chance
H1: The rate of respiration of yeast at 35oC is different from the rate of respiration at 50oC
I have worked out the mean and the variance previously. The mean of the sample at 35oC is 67mm and the variance is 21.4mm. The mean of the sample at 50oC is 61mm and the variance is 70 mm.
∴z = (67 – 61)/(21.4/12) + (70/12) = 6/7.58 = 0.792 (less than 1.96)
At the 5% level of significance there is evidence that there is no difference between the rate of respiration of yeast at 35oC and at 50oC.
It came to my attention that the variance of the sample at 50oC was very high and this is probably the reason for the result of the last T-test that compared the rate of respiration at 35oC and 50oC.
The result of the statistical test that I carried out supports what I said previously. At 35oC, the temperature is near optimum for enzymes to perform their functions, while at 20oC it is too low for the enzyme-controlled reactions to take place. Movement of particles are affected by temperature. Low temperatures make particles move slower, affecting the rate at which they bind to enzymes and high temperatures increases the movement of molecules but denature the enzymes.
Conclusion:
I have found that as I increased the temperature of the yeast solution, the rate of respiration of the yeast increased to a certain point where, as the temperature rose to a certain level, the rate of respiration eventually dropped.
EVALUATION:
After looking at the results that I collected and the way I conducted the actual experiment, I this that it was an adequate procedure. I think that I could have collected more results if I had organised the procedure better.
I have looked at my results and noticed that the first reading of the bubble length at each temperature was far lower than the rest. I noticed that the pattern is that there would be a gradual increase, but the first reading of each CO2 bubble at the start was off that pattern. This might be because the yeast had not started anaerobic respiration. These anomalous results would have lowered the value of the average when it might have been greater. Another anomalous result that came to my attention was the variance of the sample at 50oC. It was a lot higher than what I would expect. This is likely to be due to a human error, where some students had recorded the wrong readings.
I think that the biggest source of error in this experiment, which might have affected the results greatly is the measurement of the length of the CO2 bubbles formed using a ruler. The results obtained by the students and I prove very different to one another, which indicates that there is an error in measuring the length of bubbles. Apart from the last three or four readings at each temperature, the rest of the results are very different. This definitely affects the averages, the means, the variables and all the calculated values, including the T-test.
Another limitation or a source of error is maintaining temperatures. This proved to be difficult, especially that I had to keep looking at the temperatures of three water baths and record the results every 5 minutes. Any distraction or even while writing the results the temperature could increase or decrease. Temperature, as I discussed earlier, has a great effect on the rate of respiration of yeast. It determines the speed at which particles binds to enzymes and increasing it increases the rate of respiration up until a certain point where it denatures the active site of the enzyme stopping the process and hence stopping the production of ATP by the process of glycolysis.
Improvements:
The first improvement that I would suggest is affected by the fact that measurement of the CO2 bubbles was not reliable. I think that the use of an advanced respirometer that can sense small changes of CO2 concentration would be very useful. It would eliminate the confusion of collecting and recording the right volume of CO2 given off. A very sensitive respirometer would be needed to do this, because yeast is a very small organism, so reacting the CO2 with a substance and then calculating how much of that substance reacted and hence how much carbon dioxide reacted would be a sensible procedure.
Since temperature is the second ranked limitation, I would suggest the use of an electrically- controlled water bath. It would prevent temperature deviations. This would keep the temperature constant all the time. It would also increase the accuracy of the temperatures.
Another improvement could be leaving the yeast in the water bath at 35oC for longer than 1 hour before the practical. This gives the yeast’s enzymes more time to reach the maximum performance level. This would make results clearer, as yeast would show immediate changes after being in the controlled conditions for a long time.
FINAL CONCLUSION:
After looking at all the results, the tests carried out and the limitations, I conclude that as temperature is increased, the rate of respiration of yeast increases until a certain point where it drops. This drop is because of the denaturisation of the enzymes followed by a decrease in the production of ATP and the stopping of respiration.
The limitations and sources of error have changed the real results but the general pattern is still there that the rate of respiration in yeast is affected by temperature.
BIBLIOGRAPHY:
I used the following books for my background research and for some quotations in the assessment:
- Central Concepts in Biology
By Mary Jones and Jennifer Gregory
Published by the press syndicate of the University if Cambridge
- Advanced biology
By Michael Roberts, Michael Reiss and Grace Monger
Published by Nelson
- Human Biology
By Mike Boyle, Bill Indge and Kathryn Senior
Published by Collins Educational
- Applications of Genetics
By Jennifer Gregory
Published by the press syndicate of the University if Cambridge
(5) Biology 1
By Mary Jones, Richard Fosbery and Dennis Taylor
Published by the press syndicate of the University if Cambridge