Surface area would affect the reaction speed because larger surface area would increase the chance of a reaction. However I am using only liquids so this can’t be investigated because there is no surface area.
Catalysts would affect the reaction by increasing the amount of successful reactions. A catalyst provides an alternative route for the reaction with a lower activation energy. However there are no catalysts that would affect the speed of this reaction.
Plan
My task is to carry out a number of experiments in order to see how one factor affects the rate of reaction for the iodine clock experiment. To do this I am using a burette to measure volumes. I chose this method because it will be more accurate than using measuring cylinders where the amounts could easily be measured incorrectly. I am investigating the concentration and how the concentration affects the reaction rates. I decided this would be an easier factor to investigate than temperature, as it would take much longer to heat it each time. The surface area couldn’t be investigated as I am using liquids rather than solids. Catalysts couldn’t be investigated, as there are no catalysts that affect the reaction rate in this experiment.
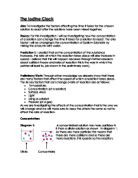
This diagram shows how I set up the experiment and the apparatus I used.
In order to carry out the experiments I used the following method:
1. Using a burette, measure out the following amounts:
- 30ml Potassium Iodide
- 5ml Sodium Thiosulphate
- 10ml Sulphuric Acid
- 10ml Starch
2. Pour the chemicals into a conical flask
3. Using a burette, measure 30ml of Hydrogen Peroxide and add this to the conical flask.
4. Use the stopwatch to time how long the solution takes to change colour.
5. Repeat the experiment using 25ml of Hydrogen Peroxide and 5ml of deionised water, 20ml of Hydrogen Peroxide and 10ml of deionised water, 15ml of Hydrogen Peroxide and 15ml of deionised water and 10ml of Hydrogen peroxide and 20ml of deionised water. Repeat each experiment three times.
Results
The first experiment contains an outlier because I was using a different hydrogen peroxide solution with a significantly lower molarity. This led to the time being much longer than the other results so I will discount this result from all averages.
Analysis
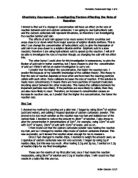
I have drawn a line graph to show my results. It shows the mean against the concentration. This graph shows a trend of the mean of the reaction speed decreasing as the concentration increases. The mean drops more dramatically between the first two points, which is probably because there is a larger difference between the two concentrations. This graph proves my prediction as it shows that reaction rates decrease as concentration increases. There is a negative correlation and I have included a line of best fit to illustrate this.
My results prove my prediction to be correct as they show that the higher the concentration, the faster the reaction. This can be explained by the collision theory, as when there is a higher concentration there are more particles to react. When there are more particles to react, the amount of collisions occurring increases. This results in a faster reaction which my experiment proved.
Evaluation
My investigation worked fairly well as it successfully proved my prediction to be correct. I carried out each experiment three times and found an average to make my results more reliable. The fact that most of these results were very close together suggests that my results were mostly accurate. If I did the experiment again I would use the same method and the same apparatus as I got good results using this method and apparatus. However I may carry out each experiment more times, to further improve the reliability of my results. Only doing each experiment three times means that if one result is an outlier, the mean is based on only two results, which makes it much less reliable. My results were mostly within very narrow ranges, as the range bars on my graph show. For this reason I am fairly confident that my conclusion is accurate. My results were very consistent and showed what I expected, so they are likely to be accurate, meaning my conclusions are likely to be accurate.
I had one outlier, which was because I used a different hydrogen peroxide solution. I didn’t have any other outliers which suggests the method and apparatus was accurate. However in one experiment it turned yellow, instead of the purple colour that occurred in every other experiment. I don’t know why this was, but it is possible that I included the wrong amount of one of the chemicals. As the time was similar to the times recorded in the other experiments, I still included this in my results.
Another way in which I could have improved my investigation would have been to investigate more than one factor and then compare the results. The title of the investigation was “Investigating the Factors Affecting the Rate of Reaction for the Iodine Clock” so by considering more than one variable I could have investigated this further. I would still have been unable to investigate surface area or catalysts but I could have carried out similar experiments to the ones I did, altering the temperature each time. This way I could have seen if the temperature affects the reaction more or less than the concentration.
References
Co-ordinated Science Chemistry 2nd Edition – Rose Marie Gallagher, Paul Ingram, Peter Whitehood
http://www.chemguide.co.uk/physical/basicrates/catalyst.html
http://www.nvcc.edu/alexandria/science/IodineClockReaction.html